Performance

Nick,

The Reward Objective has never been revised down. We have always spoken of aiming at 4% - 5% compounded p.a. better than the Total Return indices. This comes from the long-term average return of these indices being around 10% annualised.

In the Public Portfolio Investment Plans, from day 1 we have aimed at a Reward Objective, to measure how we’re doing over the long term, of being 4% annualised better than the Total Return indices.

When we first set this Objective, way back in the early 2000s with SPA3 Trader, we used rolling 5 year periods as the way to measure how we were doing.

With some input from long standing customers and some research on what other managed funds and industry Super Funds state for their funds’, especially All Share funds, as the minimum period to measure comparative performance to give any strategy enough time to play out in different market conditions, it seems that 7 years is the industry standard.

As performance is so market dependent, for a couple of decades I’ve also spoken of using 2 market runups and run downs of at least 10% for each, regardless of how long it takes, as a good ‘period’ for performance measurement. This is what should be used for backtesting a system, so this condition shouldn’t be any different in live trading.

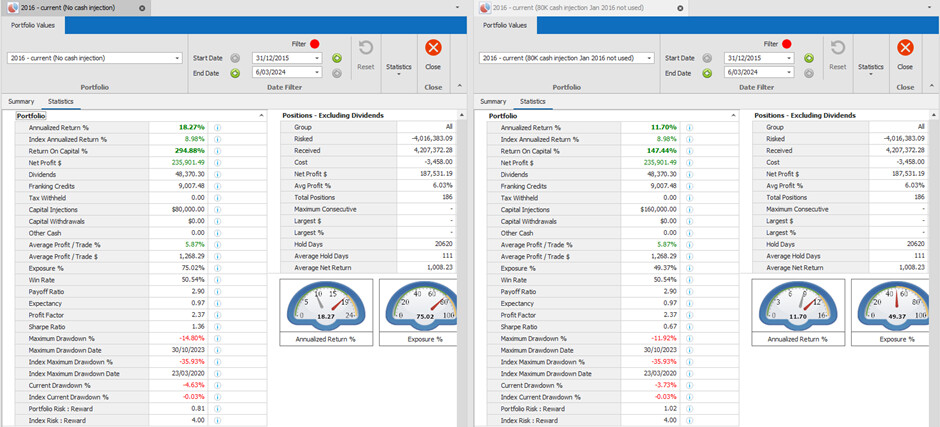
Regarding the 21% CAGR and 15% drawdown, this is the sort of simulated portfolio performance we look for, and achieved, in backtesting. We aim at this sort of level because we understand that historically known data will always be different to future unknown data, and that no mechanical system will perform at the same level in live trading as it does during historical research.

The 14% to 15% CAGR as a Reward Objective is around 2/3rds of the historically simulated portfolios to allow for this. And is also 4% to 5% better than a 10% annualised Total Return / Accumm index, over the long term.

Trust this makes sense and explains again where the 4% - 5% anualised better performance comes from as the aim for the Reward Objectives in the Public Portfolio Investment Plans. And over what time period and market conditions to allow it to play out.

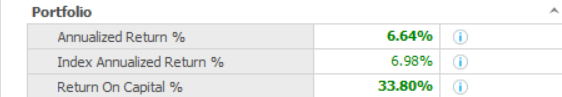
That said, if the market does better or worse the 10% annualised over around 7 years, then we still have a relative Return to aim for of 4% to 5% better.

Of course, markets are volatile in the short term and portfolio performance can vary greatly for all sorts of reasons, including reasons related to and not related to the mechanical system.

Past performance is not a reliable indicator of future performance.

HI Gary
To be clear, I never meant the calculations were incorrect. What i mean is if you inject cash at a time when your portfolio is full it has to stay in cash until you sell and rebuy, so it could mean you are more in cash for quite an extended time, and if the market is in an uprun that will impact overall performance as that portion will miss out on the uptick. Similarly depending on when you withdraw funds I think it can impact performance. I am sure the calculations are spot on, but its more the timings of injections and withdrawals that I feel can impact performance relative to a stable portfolio.
P

Hi Patricia,

I read it as that, but the thought occurred to me before your Post that we’d better check the Exposure calculation for injections and withdrawals.

Hi Patricia,

A case and point is the USA Public Portfolio which has suffered from being under-exposed for a different but related reason, reducing the number of positions from 13 to 10.

One trade has remained open for 15 months with a much smaller position size, meaning the portfolio has been underexposed for most of the time during transitioning from 13 to 10 open positions. The opportunity cost has been quite significant to the portfolio.

Yup exactly! And that is exacerbated if one injects large sum (large relative to the total portfolio value) when the positions are full and that amount sits in cash while the rest of the portfolio grows. I have two portfolios (one ASX and one US) which have been impacted by cash flow timings (thanks to Draconian foreign exchange rules and also some withdrawals to move funds into Superannuation). The result is its quite difficult to monitor exactly what affects all the moving parts have had, but I’m pretty sure the overall impact on my portfolio performance has been negative. The newer portfolio i started (US) which I plan to leave as a stable portfolio is doing really well which supports that…

Nick,

297 trades is about the same as the ASX PP which has been trading for 3 years and 10 months longer. This implies you have more than 9 open positions.

Here’s a little bit of analysis on the number if trades over the life of the ASX SPA3 Investor Public Portfolio.

Some takeaways from this analysis of live trading:

  1. Being a trend following system, SPA3 Investor struggled from 13 August 2021 to 30 Oct 2023, a 26.5 month period when the $XAO was down -11.8% in a wide-ranging sideways to down market. Over the same period, the ASX Public Portfolio was down -19.3%.

  2. During this same period, which is 27% of the life of the Portfolio, the ASX PP did 42% of its total lifetime trades.

  3. The number of completed trades during this period is very high compared to the annual average over the long term.

  4. The number of open positions that a portfolio trades with affects the total number of trades completed and the amount of effort required to trade with any mechanical system.

  5. The average number of completed trades a month over the lifetime of the portfolio is 3.0. In calendar years 2022 & 2023 it was 4.9 trades/months. For the other 6.2 years it was 2.4 trades/month.

In summary, 2022 and 2023 is precisely the type of period that tests every type of active investor / trader. Subjective, day trader, swing trader, reversion to the mean and trend follower. It is only natural that we question our methods and processes.

However, as I always say, we have to take a big picture view of the markets and of how we do things.

The 4-Week PROCESS + MINDSET Training Intensive isn’t just about trading psychology, it’s also about us understanding the wider picture of why we have expectations, how we learn, and how we self-sabotage ourselves in all walks of life. It’s just that trading seems to magnify all these.

Any other insights that can be gleaned from this analysis?

Hi All,

With regards to the queries on PM statistics:

  1. Annualized Return %. PM uses the Time Weighted Return method (TWR), in which it calculates returns between capital adjustments (Injections & Withdrawals) to correctly report performance. For periods less than 12 months, PM will clone the Return on Capital % figure, as Annualized return is only accurate for periods > 12 months.

  2. Invested %. A simple calculation of Capital Allocated / (Capital Allocated + Cash) in order to work out how invested a portfolio is. Capital adjustments will of course impact this figure. If you add cash, you are less invested than before, if you remove cash (meaning you were less than 100% invested if cash was there to take) you will become more invested.

  3. Exposure %. Sums your Invested % over the defined period, and compares it against being 100% invested.
    A simple example of this for a 5 day period, where for 4 days you are 100% invested, and 1 day you inject a chunk of capital, reducing you to 70% invested, would calculate exposure like so: (1+1+1+1+0.7) / 5 = 0.94 or 94% exposure.

In summary, to get a significantly low exposure - means that you’d have to have a significant amount of cash sitting idle for extended periods. This would be quite easy to spot on your portfolio equity curve when plotting the Cash Balance indicator onto your chart like I’ve done with the ASX Equal Weighted Portfolio below:

Hi All,

To show the impact of not utilizing newly injected capital in a portfolio, please take a close look at the two portfolio equity curves below.

The two portfolios start on the same date, one starts with $80K and accesses all the funds.

The other portfolio has an extra $80K injection on day one, but doesn’t use any of that additional injected capital.

Both portfolios take exactly the same trades over their lives.

Note that the move (growth) in both portfolios is the same, $235,901.49.

The portfolio with the extra $80K injection has a final balance $80K higher than the one without the injection. The additional $80K cash just sat idle for the life of the portfolio.

The calculated performance however, is quite different, 11.70% p.a (with extra injection not used) compared to 18.27% p.a (without injection and all capital available).

This is simply due to the calculations being done using different starting values.

What is useful to understand from this example is to see how exposure is affected. The portfolio that uses all available cash achieves a far higher exposure (75.01%) compared to the portfolio that has cash sitting idle, not being used (49.35%).

So, when making cash injections into a portfolio it is important to get those funds to work as soon as possible. Increasing position sizes when new trades are opened might take some time depending on the market conditions.

To overcome this, members might consider “pyramiding” new trades into their current open positions, depending on how much additional capital is injected relative to brokerage rates.

This means spreading the injected capital evenly across all open positions by buying the relevant number of shares in each stock that the funds allow. That way exposure will be maintained at the highest possible levels. Various “pyramiding” rules could be devised based on technical criteria.

Let’s now take a look at drawdown.

The drawdown was larger in the portfolio without the extra cash injection. Why?

Drawdown is measured from Equity curve Peak to Trough. Whilst the real dollar fall in the portfolio values will be the same in both portfolios, the falls occur from a different Peak Value.

The second portfolio Equity curve Peak value includes the extra capital injection even though it’s not being used. As a result the fall in value represents a smaller drawdown, -11.92% Vs -14.80% .

The Sharpe ratio, which compares the return of an investment with its risk is also impacted because of the extra cash in the second portfolio. As is the Portfolio Risk : Reward.

Nicholas,

While looking at some of my portfolio metrics today, your post was on my mind about wider stops and comparative performance over different market periods and conditions.

I’ll share some of my thoughts based on data for the benefit of us all learning from the market as it uniquely unfolds its present & future.

Wider Stops:
These deliver 2 things:

  1. benefits during rising and possibly sideways markets (depending on the nature of the sideways market), and
  2. disadvantages during long-lasting & severe falling markets (such as 2000 - 2003 and 2007 - 2009), depending on technical risk management rules on how soon a system identifies such as market.

As of Fri 8 Mar, the ASX Public Portfolio has $35,108 Open Trade Profit of which $23,867 is Open Profit At Risk, i.e. how much open trade profit would be given back to the market if all open trades fell enough to exit all open positions with no new entries.

image

We’ve had way more comments from customers over the years about the SPA3 Investor ATR TSL being too wide than too close.

In the next few weeks, I’m about to start burying myself in another round of research that will lead into 3 specific research objectives. I would love to hear some comments about this metric from existing users.

As I would, these two metrics: % to TSL and Portfolio Risk %:

Comparative performance between systems:
I had a look at the Motion Trader equity curve on their website (great to see another practitioner publishing a real-money equity curve) and was able to calculate the following:

  1. From 31 Dec 2015 to 6 April 2020 SPA3 Investor achieved 16.8% annualized returns (CAGR) compared to 12.2%. (4 years 3 months)
  2. From 31 Dec 2015 to 15 Feb 2024 SPA3 Investor achieved 12.3% annualized returns compared to 13.8%. (8 year 1.5 months)

This one high level metric that is purely overall performance focused. There are certainly a few more important stats that would need to be examined, both in the research period prior to live trading and during the live period of trading with real money. You would do this systems analysis because they are obviously different trend-following systems.

So what can we glean? That in the 1st half of these 2 portfolio’s lives, one did better than the other, and in the 2nd half the other did better? So, which will do better in the next 4 years? If you know a way to tell that for sure, can you please share it. Undoubtedly, one of variables it will be dependent on is market conditions, which nobody can predict.

And, to be objectively scientific about it, a trading system researcher shouldn’t just leave it at these 2 systems. Other ‘systems’ should be included too. Like, other trend-following systems, Total Return indices Trackers, Balanced Funds, All Shares Funds (eg the industry super funds), and even sector index funds.

The trader’s / investor’s objective for the research for that pot of capital should be crystal clear too. E.g. B&H, minimise drawdown, maximise profits, combo of both using a systems metric like Portfolio Risk : Reward Ratio, minimise trading. etc, or at least put some definite boundaries around these that fit the trader’s lifestyle and risk profile.

And when doing that, it is mandatory to ensure the 2001 and 2008 type primary bear markets within a Secular Bear Market are included in the dataset (as I did in my book Blueprint to Wealth). And include metrics that measure how the systems performed in such market conditions. Because such conditions are far closer to us than they were in April 2013 when the Secular Bull Market started.

I welcome others’ thoughts and comments…

Gary
That 297 is actual transactions (not round trip) so I guess circa 150 trades - still too many IMO. I haven’t checked what it is currently but trade numbers had slowed since the October low.

Nick,

The ASX SPA3 Investor Public Portfolio completed 181 trades from Oct 2019 to March 2024. This is an average of 3.56 closed trades a month. Or an average of 7.1 transactions per month. This is high for SPA3 Investor compared to its research.

From the trough at the end of Oct 2023 that you refer to, there have been 19 completed trades in 7 months. Or 2.7 per month.

From 21 Dec 2018 to 20 Feb 2020, 14 months, the same portfolio completed 27 trades. Or 1.9 trades per month.

As you can see, market conditions (and many other variables) are always at play and effect all and every stock market portfolio’s statistics. Not just a mechanical system such as SPA3 Investor.

Consider these averages against a long term ‘buy & hold’ investor who rebalances every now and then. Or adds to existing positions. They would probably do as many transactions as SPA3 Investor at times. Maybe more if they hold many 10s of positions.

What would you consider is not too many transactions for an active strategy? Or what should a minimum be for an investing strategy that is still classified as ‘active’?

And still be timely with close enough exit signals to greatly and quickly reduce exposure, even to 0%, when the market falls like it has in 1987, 2000, 2007, 2020.

There have been mentions of other strategies on this thread that have wider stops. How do these strategies handle sharp and deep market falls? Like the years mentioned in the previous paragraph.

Also, let’s not forget the MAJOR reason why any investor should be an active investor. To avoid 50% to 82% drawdowns in periods such as the years mentioned above.

Regards
Gary

Good questions Gary.

Number of trades personally would be 1 - 3 per month but to clarify; rebalance trades (whilst activity) aren’t as psychologically challenging as the negative feedback of multiple loss trades. So I guess my personality is probably more suited to mean reversion where you are ringing the cash register more often. I like trend following if the winrate is reasonable (above 50%) hence my earlier comments pertaining to the original research.

In regards minimum number of trades - the lower the better if it meets my objectives - continual grinding of the gears with losses / slippage / brokerage etc I tend to struggle with and I suspect the vast majority of traders would concur. Seeing stocks bounce higher after exit is just another ‘grind my gears’ event - but important to avoid bigger losses so I get it.

Drawdown reduction (avoiding GFC2) is the only reason I am persisting. After 4.5 years (so a reasonable window of time), the return has now dropped below the index - a return which could easily be achieved via a Vanguard ETF but (as you correctly point out), with commensurate DD risk.

I still have to pay tax on this return though along with associated brokerage and SWS fee etc so I am sure you understand my dilemma.

Any lower and we will be approaching cash rates which have zero drawdown.

I also understand it’s not SWS’s fault the market is so poor but I suppose the question must be asked, does trend following work well enough on the ASX? I am not convinced it does. The SWS system is not the only one I am losing $$ on (and I have spoken to other providers who are also struggling) so maybe it’s the modern market we are in where edges / research tools are more readily available and everyone is eating everyone else’s lunch. Maybe multi-year backtests have been done on a completely different macro with falling bond rates providing a multi decade tailwind for risk assets. Maybe everyone has reduced their hold times and takes profits earlier. Maybe we are an ‘old economy’ market with only banks and miners with very little tech. It’s hard to know for sure but very few stocks seem to trend and when they do, retraces are quick and brutal - wiping a lot of the profit away - profit that’s needed to pay for the losers. 60% losing trades and their associated consecutive ‘streaks’ is too high for my personality I am afraid.
My accountant just shakes his head each year. :slight_smile:

I have recently been made aware of an ETF strategy (ASX listed) that yields circa 11 - 12 % CAGR with a 10.5% max DD (WinRate 65%) but it remains to be seen whether it will work in ‘real life’. Seems to be a common problem and one I am growing weary of TBH. At least specific stock risk is removed from the list of concerns I suppose. As an example I have had 4 trades in WOR.ax since 2020 with losses totalling 52% - mostly after news events.

I am not sure what the solution is if one wishes to avoid a 50% equity haircut prior to retirement though.

Best wishes.
image
image

Hi Nick, thanks for telling your story, I’m sure we gave all gone through a similar thought process along the journey. I also tend to agree many of the ASX stocks don’t fill me with much confidence that they will trend nicely. I get much more excited about the US stocks which do trend to trend very strongly and also quickly. If you don’t have a USD$ account I would very strongly recommend one. Good luck with handling the mental side of trading, for sure the hardest element to handle.

Some comments relating to recent posts:

It’s interesting to see that a system with wider stops is currently beating SPA3 Investor. I have been running my own trend following system with (relatively) wide stops for years, most recently alongside SPA3 investor. I have found in some years SPA3 wins and in other years (including over the past 12 months) my other system wins. This is good because the overall drawdowns are reduced. So I’d suggest keep plugging away with SPA3, it will almost certainly do better in some years.

Also, although there have been some bad years on the ASX while the US markets have performed well, I don’t think you should read too much into that. When I first started trading (2003), the ASX was trending much more nicely than the US markets and my Australian shares did fantastically well compared with my US shares. I expect this will happen again.

Also, I’m not sure it’s reasonable to expect a better than 50% win rate on a trend following system, as long as your winning trades win bigger than your losing trades lose.

Fair comments - yep I recall 2003 as well and agree that the ASX will eventually outperform for a few fleeting moments - maybe we are finally due for a commodities run.

Agreed that the performance can improve quickly but nearly 5 years is a reasonable timeframe to expect some reward for effort. I think if you are only going to win 40% of the time you really need more big winners (50% - 100%plus). Out of my 90 losers (of 151 trades), 25 were over 9% so it creates quite a hurdle to stay profitable. You really want to be winning at three times your losers IMO - but that’s out of our control…and I am nowhere near that. It’s 13.5% vs 6.5% so closer to 2.

Anyway let’s see what unfolds.

In terms of ASX performance, have you looked at how the simulations perform with and without the stock filter? After seeing when the ATR BO was and when the buy signal was given on SBM in particular when looking at the chart it looked to be pushing into resistance, I questioned David about why it wasn’t given earlier considering when the ATR BO occurred. He mentioned that the stock filter hadn’t crossed up to 1 but you were in your right to look at the simulations with and without the stock filter. It turned out that over the last 5 years the simulated return with no BAPS and no stock filter was 29.3% compared to 17.7% over the same period with no BAPS and the stock filter on.

I must admit after watching the market using the SWS system for close to a year and finally commencing investing in the last month, that I was in drawdown immediately as I was buying stocks as they were pushing into what looked to be resistance. I’ve now changed the SPA3 Investor to only provide signals with the stock filter off which David said was a perfectly acceptable method of using the system. The reason for having the stock filter on is that is there are less trades overall and less drawdown during a GFC type situation. Having it off still protects you from a GFC type situation.

With regards to the SBM trade it does look to have broken down below that symmetrical triangle and the ATR TS is sitting at 21c which represents a ~30% loss with the stock filter off. I’m still following the rules and whilst not happy about this, hope that in the end I make it back with the stock filter off or it bounces at the current support level, gold price is holding up here OK. Without the stock filter on, the buy was given at 18.5c versus 29.5c with the stock filter on.

Interestingly I was reading some of the documents and from what I could see the stock filter applies to the ASX and not the US markets. Is that correct?

I’ve seen another system which uses a range trading method which I assume would work better on the ASX though this system was only available for the US market from the limited research I did on it.

All,

Great discussion. Oodles to respond to. Which I’ll do here in a written format. Some of the discussion behooves a webinar announcement of sorts to cover research work that we are doing, which I’ll allude to in one of my responses. I’ll respond in multiple posts, one question/explanation at a time.

Also, I’m going to use individual posts to provide explanations that hopefully helps everybody who reads them. Please don’t take anything I say personally.

First up is one of Nick’s statements:

Number of trades personally would be 1 - 3 per month but to clarify; rebalance trades (whilst activity) aren’t as psychologically challenging as the negative feedback of multiple loss trades. So I guess my personality is probably more suited to mean reversion where you are ringing the cash register more often. I like trend following if the winrate is reasonable (above 50%) hence my earlier comments pertaining to the original research.

This is a clear admission of what Mark Douglas identifies as the WHOLE CRUX of “psychologically challenging” issues that ALL traders suffer to some degree. most to a high degree. The higher the degree the suffering, the less successful, peaceful and profitable an active investor will be, over the long term.

Meaning that, even if you’ve handled all the market conditions that you have so far in your active investing career, eventually a set of adverse market conditions will come around that you can’t handle with the level of money you’ve had, or currently have, at stake. This will flush out the making of mistakes, the results of which will take you beyond the thresholds of what you can psychologically handle.

For 2.5 decades I’ve heard traders and analysts (there’s a massive difference between the two), talk about using a system, or even a subjective trading process, that suits their personality or trading style. In truth, all that means is that they can’t handle the “the negative feedback of multiple loss trades” of any given process they’ve tried their hand at. Or handling being in drawdown to the extent they get to.

No amount of different types of analyses for trend-following or mean-reversion systems, styles, indicators, money management, whatever… will remove “the negative feedback of multiple loss trades”.

Eventually a set of market conditions will come around where every single one of all styles/approaches etc. will create an amount of “negative feedback of multiple loss trades” that will be too much to handle for a trader who hasn’t yet reached a peaceful and unflappable trading mindset.

I am not the originator of this thinking and teaching. It is Mark Dougals’s. If you know of a trading psychology coach who is more eminent and successful at turning traders’ lives around with different material, please post their name and works here on this Forum.

Everybody gets mugged by reality in the market at some stage. Some get mugged every single day that the market is down, and their portfolio is down. Others only when losses or drawdown are beyond their threshold.

In The 4-Week PROCESS + MINDSET Training Intensive Dave and I discuss ad infinitum what manifests in your thinking and decisions when you surpass your threshold.

The way your subconscious defends itself (mostly without you even knowing) is by continuously repeating the same mistakes over and over again. Forever. Until you change the way that you think to align with what Mark Douglas teaches us in Trading in the Zone.

The degree to which you think you don’t need to instill (not just read and be aware of) Mark’s material into your mind, is the degree to which you’ll always feel discomfort from the market when it doesn’t do what you expect or want it to.

Regardless of what your conscious mind thinks that it knows about the market and market analyses, it will NEVER attain the level of comfort, peace and profitability that your subconscious mind automatically expects. Until you align your subconscious mind to think from the market’s perspective.

As Dave and I say so many times in the Training Intensive. “You cannot analyse away emotional pain.”

Emotional pain is felt when the WHOLE CRUX of Mark Douglas’s Trading in the Zone is not attained by an active investor / trader. And that happens when a trader has NOT truly accepted all the risks of trading.

I know from my team that many members, who were already SWS members in November when Dave & I conducted this training live, have decided that they don’t need to do this training, for whatever reason.

If you’re reading these posts and having similar thoughts, to any degree, to what is being discussed here, then you really do need to do this training.

No matter what trading system, approach, style, analysis tool you use or want to use, a time will come when a market-misaligned mindset will cause discomfort to the degree that you will self-sabotage yourself and / or take yourself out of the opportunity flow. Unless you align your trading mindset to truly think from the market’s perspective.

TBC…

Great post Gary,

I had similar psychological challenges for over 15 years until after studying “Trading in the Zone” and listening to the audio book version several times over. The thing that I reckon got me across the line was to “get” that a robust back-tested trading system such as SPA3 Investor is a purely “emotionless mathematical statistical entity” that will require faithful adherence to the rules over a sustained period of time to allow the Edge to express itself. Each stock in the universe of stocks is just a means to an end, and nothing more. I now don’t really care what the name of the particular share is, they may as well all be called “Boring Corporation Ltd” as far as I am concerned.

I rationalise it as follows…Its like I am the “House” at a Las Vegas Casino. The punters on the gaming floor are the gamblers, enjoying the excitement of a night out where they may leave with more than they came with, or not. As the House, I am not gambling, I am just systematically harvesting money from the punters over time, The “punters” in my world are all those ASX market participants engaging with the market without a robust backtested trading system. They are simply gambling, they are looking for excitement and entertainment, just like if they visited the gaming floor at the Casino. But for me as the “House”, there is no excitement, no glamour, no nothing - just the faithful execution of the system. I am the croupier who just deals the next Blackjack hand mechanically with no emotion ( ie:…I just take the next trade mechanically…), safe in the knowledge the odds are stacked in my favour as I sit in the position of the “House”. Sure, I could lose more Blackjack hands (ie: trades…) than I win, but I know I have a positive mathematical expectancy working in my favour. My average win should be bigger than my average loss. Which interestingly has actually occurred on all of the multiple different portfolios I am running on the ASX for the past 2 to 6 years for myself & my wife, my elderly parents and my young adult children, depending on the date of inception of the portfolio. I also have fewer wins than losses on each portfolio as I cut loss trades early, so this logically stands to reason. Until I completely surrendered to the system a few years back, “peaceful” trading from my own psychological viewpoint was not possible. I fully appreciate it is challenging psychologically if one hasn’t yet fully wrapped their heads around the fact that this game is about systematically taking the next trade regardless of the name of the stock. It can be really frustrating, I have been there myself. But the “Edge” will look after you, and one needs to execute faithfully to allow the Edge to play out. There should be no emotion, just boring mathematical statistics playing out, just like at the Casino from the House’s perspective…

I hope this post helps any SWS members who are currently enduring psychological pain re their trading. My sense is that until one gets their head around the implicit positive expectancy built into a system such as SPA3 Investor, and what is required to allow the Edge to be ultimately expressed, then one will continue to be psychologically challenged each time the market “tests” us.

Hope this helps somewhat.

Two questions for this thread:

  1. How do we confirm the Edge maintains its edge over time…?? Since it is a back tested system based on past performance, can the future market performance deviate enough that the current Edge in the SWS system is no longer an effective edge…?? I know there is no crystal ball, but at some point, the next two years will be in the past, and can we tell them whether the Edge remains sharp for this timeframe or not.

  2. For the novices, where do we find information on turning off the stock filter in SPA3 Investor portfolio, as I was one of the “lucky” investors that received the signal to buy SBM when I started trading in earnest in April.

Thanks,
Cam

Great post Rob.

I know that you “got this” from studying Trading in the Zone. As we’ve discussed face to face when we’ve come to Perth.

For those who don’t get what Rob is saying, trading like you’re the House is covered in Chapters 7 & 11 of TitZ.

I also cover it in Session 3 of The 4-Week PROCESS + MINDSET Training Intensive starting at timestamp of 44:28 for 10 minutes. I also cover it in Session 4 starting at the timestamp of 22:54 until 33:00 minutes.

All SWS Members have access to this Training Intensive.

image

Your experience has been that you surrendered to an edge that you trusted so that you could train yourself (your subconscious) to build self-trust to “flawlessly execute” in the environment of the market. Self-trust results from practicing a series of experiences.

IMO you now have the mental skills to be able to “flawlessly execute” any “edge”. You also now have the skills to determine the existence of an “edge”.