Performance

Hi everyone

Thought I would chime in with my performance so far. I run 2 portfolios on the ASX with SPA3 Investor - one has recently increased from 11 to 12 stocks for the SMSF and the other has 8 positions (outside of super). Both started October 2019.

The larger portfolio has a Winrate of 45% and Profit Ratio of 1.7 so is profitable but only just. It has returned 14% at 11% CAGR.

The smaller one is at 55% WR and PR of 1.63. It has returned 21% at 14.6% CAGR

It’s early days of course and an edge can take a bit of time to play out but the Profit Ratio is materially below the high 2’s / 3 of the system and the market post Covid has been fairly strong up until this month.

Both portfolios don’t take gold stocks nor Telstra and QBE but do take everything else. Both portfolios had the recent WOR large loss trade and I have had both FPH recent loss trades.

Closed trades include Friday’s signal prices so figures will alter slightly when the REA and ALQ exits get their actual traded prices Monday.

Both portfolios hold decent unrealised profit trades in JHX and the larger portfolio holds CSR as well. I was wondering if these figures compare ok to other members and if anyone wanted to discuss their own experiences.

There has been quite a bit of give back in the past few weeks too (in line with the market) but giveback (recent examples like JBH JHX DMP etc) is a characteristic of trend following systems otherwise you would never get the really big trends.

In regards behaviours, if I could critique my own performance over the past year or so it’s probably been fear of taking some trades like ILU / ANZ (loss avoidance) which have gone on to perform well. Everything else seems ok though - I am not holding stocks after exit signals or cutting profits short - average $ win is just too small.

In addition, I can’t seem to reconcile the public portfolio in Trademaster so tried to look at it in Beyond Charts but it appeared to contain positions that should have been closed (JBH WOR and DMP)? It’s quite possible I am doing something wrong though.

My aim is to try to match / exceed the public portfolio performance over time.

Anyway I just wanted to touch base as trading can be a lonely endeavour!

Cheers all

Nick

Below is my snip of the Public Portfolio.

On the face of it, it appears reasonable for the period. You cannot really gauge performance, however on only 1.5 years.
Trying to outperform the public portfolio will be hard as it benchmarks against the All Ords plus a margin. It is also100% mechanical and consistent to the pinnacle of the researched edge.
You appear to put some discretion in yours (in an effort to beat the PP maybe) and on my experience, most times I am inconsistent or discretionary, it costs me and thereby degrades my edge. Of course, the hardest aspect to a mechanical system is to be mechanical, yet being mechanical requires the least effort. Funny how we torture ourselves over such simplicity.

Yes good points about the irony of the mechanical approach. I have only taken TLS and QBE out of the mix because of their skinny edges (especially TLS) and the gold stocks’ win rates are just too low for me to stomach (I understand they have an overall edge though).

It’s a great system however and it handled the Covid crash fantastically well.

My personal behaviour gap is not filling the portfolio quickly enough on a couple of occasions (like ILU and ANZ) and missing the run on those.

On reflection, I think the overall profit ratio of the PP was initially lower too as it had to wait for more big trenders to unfold so it’s most likely just a time / duration issue as you point out.

Thanks for your thoughts Phil

Hi Nick,

As Phil pointed out, 1.5 years is still early stages of the portfolio. We look to measure performance over at least 5 years and our goal with the SPA3 Investor ASX Public Portfolio is to beat the ASX200 accumulation index by 5% CAGR over these rolling 5 year periods.

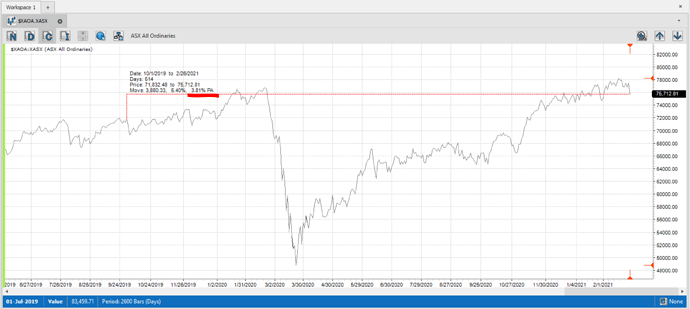
The picture below shows the Performance of the All Ords Accumulation Index since 1 October 2019. Note the market has achieved a CAGR of 3.81% over this period. Compare this to your own performance and all of a sudden things don’t look too bad…

Keep working on being strictly mechanical and trusting the process and the system has shown that it will out-perform the market over the long term… We know it can be hard, which is why we keep repeating it and encourage our members to strive for the strictly mechanical mindset. It’s something we all have to work on continuously.

I’d also like to thank you for sharing this on the forum. I wonder if any of our other customers are in a similar boat or have any other concerns/worries they’d like to raise? How is everyone feeling with the current market conditions?

I encourage you all to engage and share your experiences on this forum. We would like this to be a space where all our members feel welcome and can turn to to share their experiences and help each other along the journey.

Kind Regards,
Vincent Duggan-Jones

Thanks Vincent - yes it may help others to know they don’t have to battle on alone.

Cheers

Nick

It seems I got into SPA3 Investor at a bad starting point (November 2020). I have followed the signals mechanically including a few BAP trades to fill vacant slots after a sell, but overall I have lost 2.4%. Fortescue was a good buy and RIO still has a decent unrealised profit, but most of my trades have been losses so far. I hope that’s some consolation to those whose gains have appeared disappointing. I realise that in the long run numbers will average out but I wish I had started a few months earlier and got the benefit of the post COVID rally. Good to hear from others. Thanks for speaking up, Nick.

Thanks David - yeah that’s way too soon to gauge anything IMO. You could have just as easily been up / down 5% in such a short space of time. And you tend to return negative early on as you realise losing trades faster than the winners. Keep plugging away though.

Nick,
The Profit Ratio / Payoff Ratio for this period is relatively low.

This could be caused by a relatively high brokerage rate for the average position size. Which could potentially be caused by the combination of too many open positions paying too large a brokerage rate for the portfolio size.

Regards,
Gary

Hi all
I started my EW portfolio on 4th May 2020. Current performance as of Friday 26th Feb was 12.6%. Currently in drawdown from equity high on 8th Feb when the return was over 20%- part of the system doing what it has to. I am just here to manage the algo of the system.

Hi Nick and others,
You can be lucky with your start point or unlucky like my son who started 3 weeks ago, but I do believe that over time by sticking to a mechanical mindset the system works. Mind you, I haven’t always done that, and have let the “Noise” keep me out of good trades e.g. the banks, however the more I go on the less I take the noise into account and it definitely pays off.
Starting my ASX EW Investor portfolio in Sept 2017 my win rate is 42.3%, Profit ratio 2.31%, return of 12.6%, which dropped in last 3 weeks from !4%, and a CAGR of 51.66% so pretty happy at this stage.
Hang in there Nick and other newbies, its worth it.Regards,
Kym

Great stuff Kym - and well done for getting your son on the journey at I presume a fairly young age!

I find this good feedback as I started my journey just before Christmas 2020. My first 6 sells have all been losses. However, I trust the system as I’ve read or watched almost everything in the Education centre. The continual repetition by Gary and David that “anything can happen” has proved to be true. I know that there will be profits in the future.

Nick, my son has just turned 38 which I think is a great age to start. He has had a small portfolio of blue chips for a few years, and apart from paying good dividends, have been going nowhere really, so I am pleased to have finally convinced him to give the SWS a go and am sure he will do better over time, despite having started in a volatile time 3 weeks ago.
Regards,
Kym

Hi All
I have a number of portfolios, all profitable to varying degrees.My largest are ASX EQW stocks ( 9 positions; started 30/06/2016) and US EQW(recently increased to 15 positions; started 30/01/17);
ASX CAGR as of today is 24.29% expectancy .87
US CAGR 12.18% expectancy .76
I can’t explain the difference in performance, ASX has been pretty steady from the outset whereas US only came into profit in the last 18 months but has been very profitable since then and has benefited by the increase in positions.My experience overall is the method works well but you must be patient and ignore the short term. You also must be totally mechanical and follow your plan.
Hope this is of interest

Hi Wakefield,
Congratulations on your returns. Your ASX portfolio has outperformed the SWS Public portfolio by 5% p.a…that’s a great result over the past 4.75 years. You’ve allowed the Edge to manifest itself in your portfolio by being consistent, disciplined and patient.

By comparison the All Ords accumulation index returned 10.25% over the same time that your portfolio returned 24.29%.

Your US portfolio has also done well returning 12.18% p.a after a slow start, and is currently 2.7% p.a behind the SP500 Total Returns Index having completed just on 4 years of trades.

It takes time to build up the sample size and the minimum recommended time frame is 5 years. Sometimes one market will perform better than the other, but we’ll never know in advance and the great thing is that we don’t need to know what’s going to happen next in order to make money in the market. (Fundamental Truth NO. 2 :slight_smile: )

You just need a decent dose of perspective, a system with an edge, and a growth mindset.

Thank you to all members so far that have contributed to this topic. Keep up the great work.

The following may be of interest to show that despite some errors (mine) and health issues in 2016 - 2018 the system works well. I only trade the ASX with 9 positions and exclude Aristocrat and QBE.
Cheers,
Rob

Date Annualised Return on Average profit Drawdown % Win Rate %
return % Capital % per trade %
2015-2021 19.4 151.48 5.61 14.69 46.15
2015-2016 26.57 11.71 9.85 69.23
2016-2017 7.75 2.13 11.56 34.62
2017-2018 -7.74 3.09 12.28 30.95
2018-2019 57.86 8.18 11.69 56.52
2019-2020 25.96 8.88 14.69 61’54

Rob,

Thank you for contributing your performance to the Forum. Gives us at SWS a warm fuzzy feeling knowing that the SPA3 Investor system helps investors achieve results like you have when executed close to what it is intended.

I would like to acknowledge that although this is Rob’s 1st post to the ‘new’ Forum, he posted many many times to previous SWS Forums dating back to the mid to late 1990s.

Thank you for your custom over the years (actually, decades) Rob.

Best Regards,
Gary

P.S. Other readers of this post should compare Rob’s annual results (assume FYs) to the $XJOA, which is up 57% from 30/6/2015 to current, or 8.2% Annualised Return.

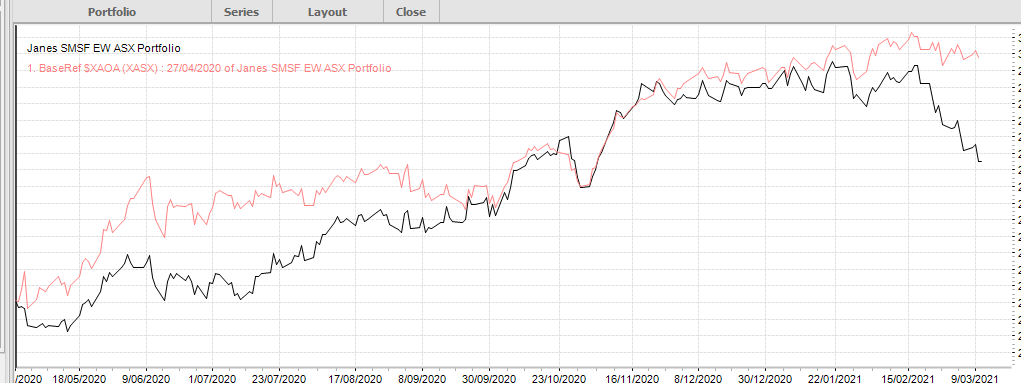
Hi all, I have been using spa3 investor since May 2020 and have been going along nicely with 9 positions on ASX. I have not failed to follow a signal and followed every rule. I attach a snip of our portfolio compared with the $XAOA. Recent times have shown that we are performing poorly against the market in general and would have been much better off just tracking the ASX 200. I’m sure the advice will be don’t assess performance until we have been going 5 years but it seems that while the market is doing well the system does well, but when the market has a hiccup the system is not doing what it is designed to do - ie perform better than the market during retracements. I’d be pleased to hear from long term clients who have recovered from such positions and have still managed to beat the index by several percent. Our brokerage is 0.12% per trade.

Hi Neil,
Good to see that you have been satisfied overall with the/your SPA3Investor performance. Individual performances, especially over the fairly short term, can vary from one person to another because each will have a different set of holdings. But I don’t think the system is meant to cover all the “hiccups” as you suggested. It is meant to cover (protect from) the more significant downturns, although there haven’t been any since May last year.
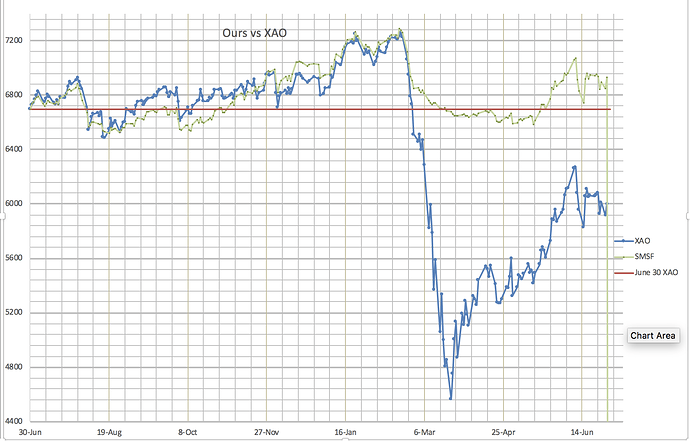
However, taking a slightly longer view (from Jan 2020), the system did do its job. In my case, I chart my investment in comparison to XAO (similar to the XAOA), beginning each financial year and setting mine to the same index value as the XAO on June 30. The chart attached (FY20) shows what happened to both in Mar - Apr last year and in the months following. We were both at about 7250 in early March, then the ‘market’ dropped to about 4600 (almost -37%) while my portfolio stayed above 6500 (less than -9%), which was only slightly below the year start. As I said, each investor’s chart would be different in the details for a variety of reasons, but I would expect they would all show a similar de-coupling from the XAO during the significant drop. After that, the charts roughly ‘re-coupled’ but mine at a noticeably higher level.

Good thread this one.

Neil, it’s always hard when you get out of sync with the market which is what’s happened the last few weeks as it’s been quite choppy (which is really the worst of conditions for trendfollowing IMO).
For example, Aristocrat(ALL) has given a few false starts for me of late where you get tipped out at the low of the range but you only know that after the fact.

Given your start date you missed the crash anyway but the system handled it really well - and those types of markets are what will set your wealth back quite a bit. Unfortunately the price to benefit from that is the loss trades from the chop.in the meantime but it’s all part of the researched edge. Just have to remember to hold those winners and squeeze the full run out of them so they cover the losses.

Like I am doing with hopefully FLT JHX and CSR.

And try to keep a long term view!