Key considerations:
No. of Trades
Average Profit
Win Rate
Expectancy
Maximum Drawdown
Keep in mind that simulations are best run at a portfolio level to see how the edge unfolds, but you can see the impact of the stock filter being applied in this example.
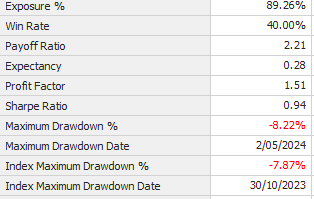
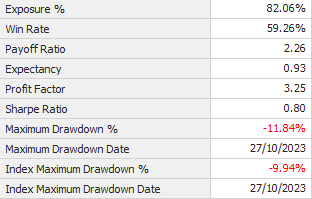
There is still an outstanding question that needs to be cleared up from the last time you posted your results in this thread on 28 Feb and which you don’t show in this image, that of Exposure %.
Your portfolio Exposure % back then was 50.28%, compared to 88.71% for the SPA3 Investor ASX Public Portfolio over the exact same period.
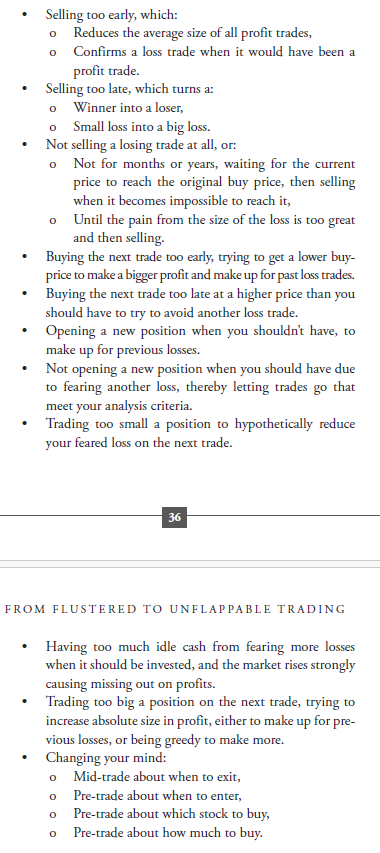
When our members have posted the results of their mechanical portfolios over the last 25 years on our Forum, everybody assumes their mechanical execution in flawless. Many see “flawless execution” of a mechanical system as entering the trades that they do on the correct entry date and exiting on the correct exit date. Here is list of the trading errors that traders can make:
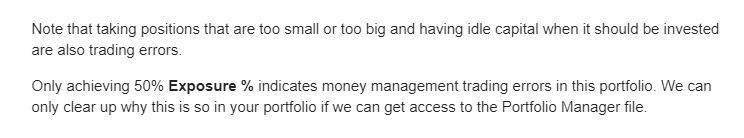
Note that taking positions that are too small or too big and having idle capital when it should be invested are also trading errors.
Only achieving 50% Exposure % indicates money management trading errors in this portfolio. We can only clear up why this is so in your portfolio if we can get access to the Portfolio Manager file.
I also understand it’s not SWS’s fault the market is so poor but I suppose the question must be asked, does trend following work well enough on the ASX? I am not convinced it does.
The word “fault” should never enter any investor’s mind. There is no-one or anything to blame. The market is a probabilistic environment. We have to learn to think from its perspective. Not ours.
When we impose our expectations on any “anything can happen” environment, we come up with questions like “does trend following work well enough on the ASX”. As if what has happened over the last 2.5 years is a major input and cause of what will happen in the future.
I could write a long answer on how to think from the market’s perspective. But rather than do that, like I have done for the last nearly 20 years in blogs and Forum posts, Dave & I created a course based on Mark Douglas’s book Trading in the Zone and James Clear’s Atomic Habits.
It’s called The 4-Week PROCESS + MINDSET Training Intensive. The course takes you through Mark Douglas’s book in a way that many who have struggled to “get it” by just reading the book in the past, now “get it”.
You will find all the answers therein.
Here’s the bottom line to all readers of this post: you will never be able to trade any system in any market, mechanical or otherwise, as it should be, flawlessly, in a peaceful way with no mental conflict or discomfort about any outcomes, individual trades or portfolio returns, over any period, until you attain the trading mental skills that Mark Douglas coached.
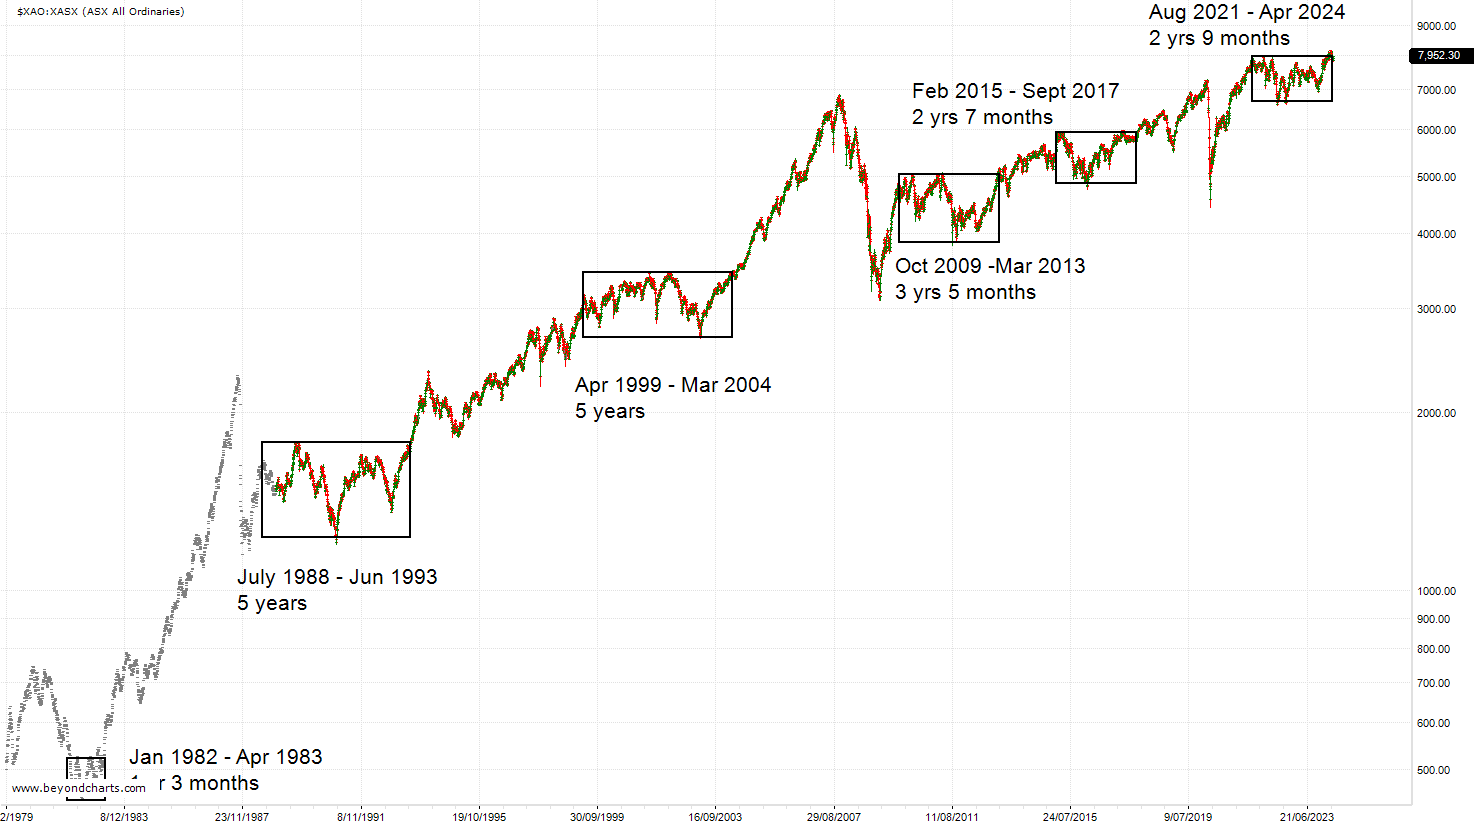
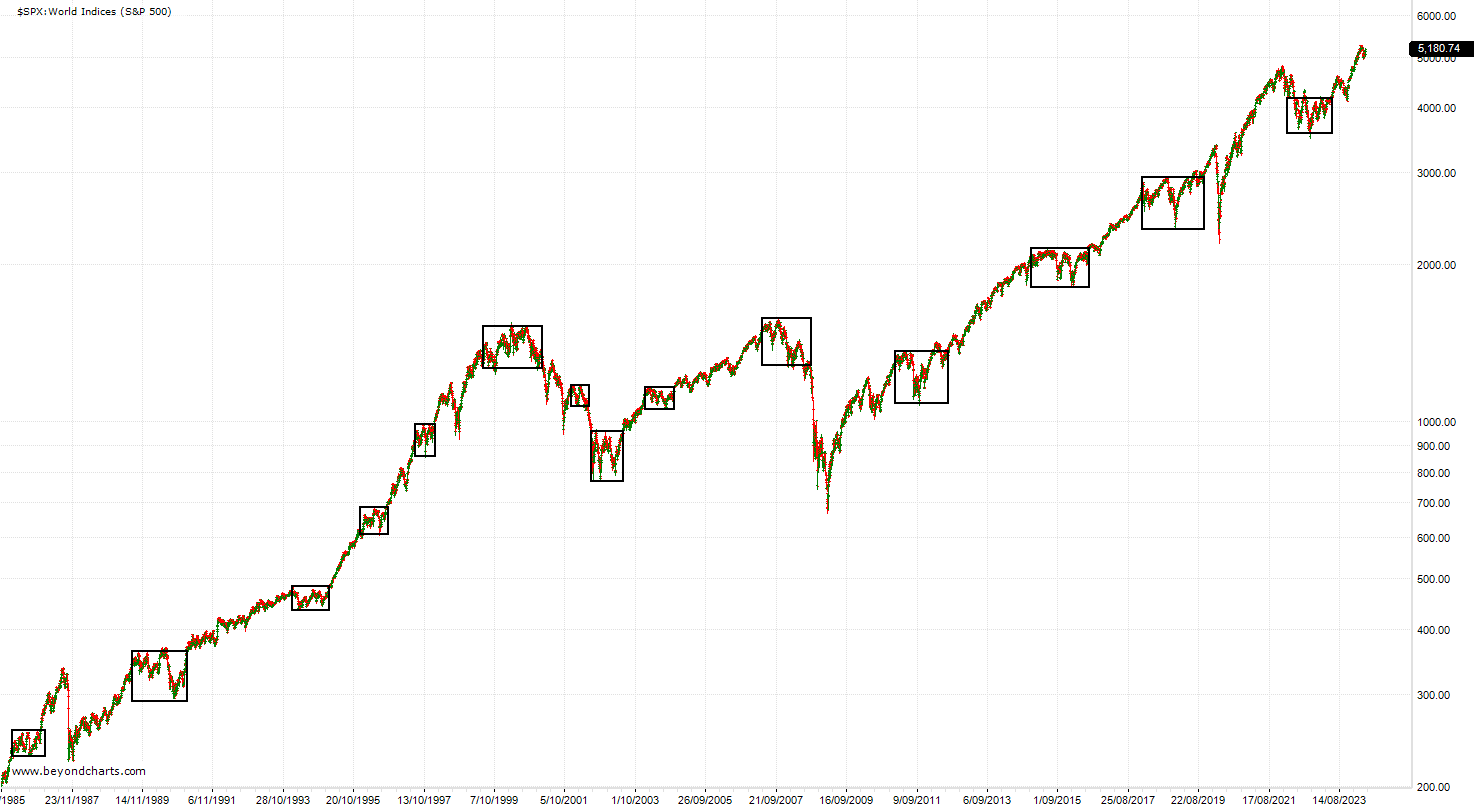
To conclude this post, here is a chart of the All Ords since 1979 showing the major non-trending periods. Is it never going to trend again? One thing is for sure - you don’t want to be trading a mean reversion system during periods when the market is trending. Up or down.
This chart shows the $XJOA & its tracker ETF STW, and $XKOA (ASX300 Accum) and its Vanguard tracker ETF VAS. STW and VAS exclude dividends but include their ETF fees. I have used the Base Ref start date from 23/10/2019, which is the date your portfolio was started in your post in this thread on 28 Feb.
$XJOA & $XKOA exclude the fees that their respective tracker ETFs charge (getting lower & lower by the year). And obviously exclude taxes too.
I assume that you re-invest your dividends into the portfolio results you shown above (otherwise your returns will be higher). I assume you exclude any Franking credits. Which we exclude from the SWS Public Portfolios as Franking credits (more than) offset the SWS annual data & support fees.
The bottom two index ETF charts show the lack of trending over the last 2.5 years.
Dividends play a huge role in ASX returns. That is, the difference between the ETFs and the indices they track (they grey lines).
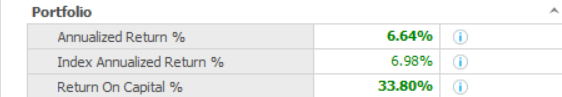
Over a period where SPA3 Investor has not performed anywhere near what it’s capable of, the SPA3 Investor Public Portfolio (which is my personal money) has still outperformed the indices.
So not so easily achieved investing in an index ETF. With the risk of a 50% drawdown when the next Secular Bear Market comes around.
The detail I’ve gone to here about returns, fees and Franking credits is the same detail that ASIC has held us to when they have audited and questioned our website and what we say there about the performance of the SPA3 Investor ASX PP.
I assume these are backtesting results. Which should be over at least 10+ years and cover two decent bear markets of at least 20% drawdown, but preferably include the 50% falls in 2001 and 2008.
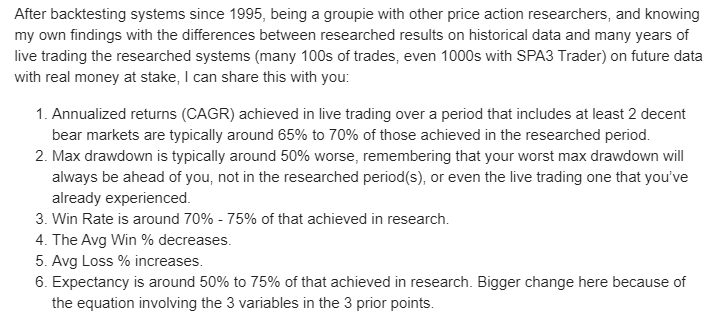
After backtesting systems since 1995, being a groupie with other price action researchers, and knowing my own findings with the differences between researched results on historical data and many years of live trading the researched systems (many 100s of trades, even 1000s with SPA3 Trader) on future data with real money at stake, I can share this with you:
Annualized returns (CAGR) achieved in live trading over a period that includes at least 2 decent bear markets are typically around 65% to 70% of those achieved in the researched period.
Max drawdown is typically around 50% worse, remembering that your worst max drawdown will always be ahead of you, not in the researched period(s), or even the live trading one that you’ve already experienced.
Win Rate is around 70% - 75% of that achieved in research.
The Avg Win % decreases.
Avg Loss % increases.
Expectancy is around 50% to 75% of that achieved in research. Bigger change here because of the equation involving the 3 variables in the 3 prior points.
Win Rates approaching 70% and greater for trend following systems typically suggest curve fitting. Or a research period that excludes large enough and long enough bear markets.
I could go on, but there are a lot more variables involved in comparing mechanical systems, not the least of which is the length of time that it has a live trading track record with real-money at stake.
And then there’s the most important variable, did the trader executing it with money at stake “flawlessly execute” the system precisely according to the rules without any trading errors or without using any personal subjectivity that another trader wouldn’t have access to?
Peter, you provided the answer on SBM in your post.
Some comments:
Looking at examples of one, two or a few to form an overall view about the market, a system a trading approach, whatever, can be very dangerous. It can skew one’s understanding to create a limited perspective. But certainly, an example of one can be used to show & tell, as you have done.
Yes, prior to releasing the revised parameter multiples for SPA3 Investor about a year ago, we ran many simulations with & without the Stock Filter, starting from 1992 (all the data) and another 5 starting periods, which incorporate a runup before a market decline. E.g. various dates in 1999 leading into 2000 - 2002, and in 2006 leading into 2007 - 2009. We do this to have a fully invested portfolio BEFORE a big bear market starts. ‘Various’ start dates to create a different mix of stocks in a portfolio at the top of the market.
The 5 years simulation you ran definitely shows ‘without Stock Filter’ as better. You could also start your 5 years at different dates within 2 months either side of the date you used - to create a different mix of stocks. And also, with a different # of open positions. You would find ‘without Stock Filter’ to be better in all Simulations over this short period, using a number of portfolio metrics.
However, running simulations over all the periods that we did from 1992, ‘with Stock Filter’ came into its own when incorporating the 2 severe bear markets that started in 2000 and in 2007. We used a number of portfolio metrics to determine this.
Simulations over more recent periods, viz.10, 7, 5 and 3 years were all better across the board ‘without Stock Filter’ for the ASX.
For the US, even including the big bear markets, the improvement ‘with Stock Filter’ was too marginal relative to the improved gains that would be given up ‘without Stock Filter’. Hence the difference between ASX and US settings.
The business was faced with a choice at release time in Apr/May last year whether to use the Stock Filter or not with the ‘default’ signals published via the SWS App and in the ‘default’ SPA3 Investor Scan in Beyond Charts.
Because investing is risk management first, returns second and being fully aware that “anything can happen”, I decided to err on the side of caution, pending further research, and release the ‘default’ ASX SPA3 Investor parameter settings ‘with Stock Filter’ on, and ‘without Stock Filter’ for the US.
This means that the ASX and US Public Portfolios also used these settings.
I can assure you, I didn’t want to put a handbrake on mine and all SWS members’ portfolios. But what if the market had fallen by 35% over the last year?
So, what about going forward from here? This is the pseudo announcement that I alluded to in a post yesterday.
Our research team (these days it includes 3 others in the business incl. dev’s), has been researching (and further developing our software) to be able to turn the Stock Filter on and off depending on market conditions.
I didn’t want to ‘announce’ this until we were closer to a more solid outcome. Whichever way it goes. However, my hand has been forced somewhat
Research continues on using an On / Off Stock Filter on both the ASX and US markets using various market risk timing criteria to determine when to turn off and on.
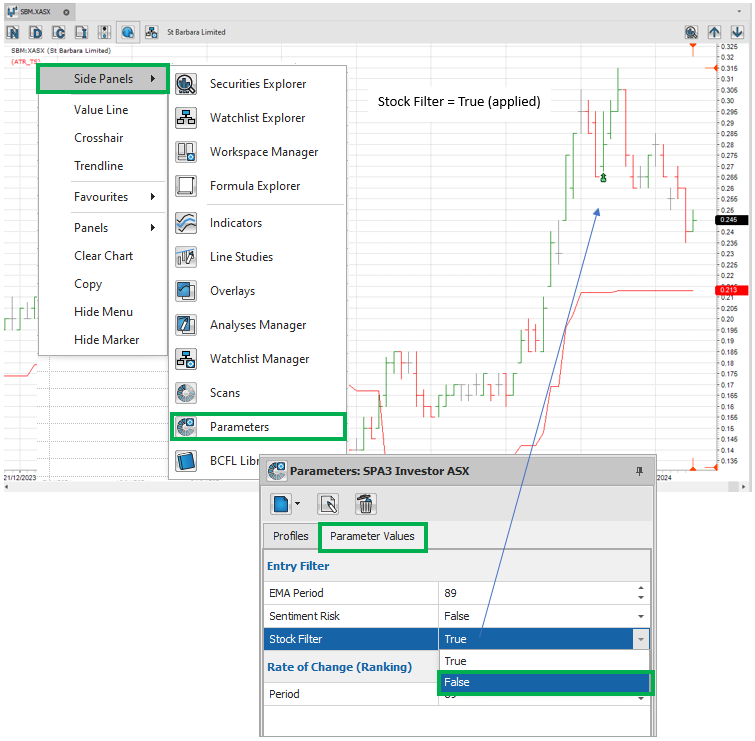
In the meantime, every member has the option to turn the Stock Filter off and on, if so desired. In the Side Panels, Parameters, as per my post last night in response to Cameron.
As of 2.5 months ago, we introduced new functionality where you can now also do that in the SWS App. In the SWS Alerts App, goto Profile (bottom right corner). SPA3 Investor, Enable ASX Stock Filter, and slide it off. So no blue is showing.
This will now deliver SPA Investor ASX signals ‘without the Stock Filter’ applied to entry signals. Regardless of what setting you have set on YOUR charts and Scan in Beyond Charts.
In the meantime, while we conduct our research, you can use SPA3 Investor signals on the $XAO to determine when to turn the Stock Filter on and off for SPA3 Investor ASX stocks signals.
This is one of THE biggest problems that active investors struggle with. It goes to the heart of the discussion on this thread. Performance. The answer is essentially about trust. At three levels…
Before explaining the three levels, the direct answer to your question is: we don’t know whether an “Edge” will maintain its edge and advantage over the market over time. If we did, that would be certainty.
Dave & I cover in the The 4-Week PROCESS + MINDSET Training Intensive James Clear’s Atomic Habits, where he explains how our minds are hardwired to seek to be right and predict getting positive rewards in the future. And how human beings struggle to build habits in environments where we get lots of negative feedback. Sound like trading the market?
Market indices spend over 90% of their life in drawdown! Around 50% of trading days over the long term are negative! We cover more detailed stats in the Training Intensive in Session 2.
Active investors admit that “there is no crystal ball” yet seek certainty (there are no degrees of certainty, it’s either certain and a probability of 1, or less than 1, and uncertain) by wanting confirmation that “the Edge maintains its edge over time”.
James Clear tells us where this thinking comes from. But it’s more than thinking, it’s human beings default mental setting. It’s hardwired in our automatically operating subconscious minds, as beliefs. Until we unwire our subconscious by instilling new beliefs wrt trading. How do we do that?
The answers are in Mark Douglas’s Trading in the Zone.
More specifically, in the The Uncertainty Principle from Chapter 6, which we unpack in Session 6.
Back to TRUST.
Sooner or later, we have to confront, and then completely accept, the reality that the market can do anything at any time over any timeframe. More than half the time it will NOT do what we are hardwired to expect, or predict, it will do. We will never know the timing of the ‘half’ or over what period the ‘half’ will occur. It’s open to too many ever-changing variables, making its movements random.
Meaning, our task as a successful and skilled trader is to have NO expectation, projected into the future, of what the market will do. It doesn’t mean that because the market, or your trading account value, has risen strongly over the last month, quarter, half-year, year, 3 years, 5 years or 10 years that it will continue to rise in the same or similar way. Regardless of what method we use.
Conversely, it doesn’t mean that because the market, or your trading account value, has fallen, or not risen to a new high, over the last month, quarter, half-year, year, 3 years, 5 years or 10 years (the NASDAQ100 TR index took 16 years & 3 months to rise and remain above its previous high - 2000 to 2016) that it will continue to fall or track sideways in the same or similar way. Regardless of what method we use.
Our job as a skillful trader is to trust: the market, ourselves and our edge(s).
The opposite of trust is fear. You can’t trust and fear at the same time, one will get the upper hand.
Trust can lead to success, peace and joy. Fear will never lead to these but rather to indecision, failure, discomfort and despair. The three ‘trusts’:
Trust that the market provides an endless stream of opportunities in all its everchanging timeframes. And that it moves in price trends in all these timeframes.
Self-trust in ourselves that we can flawlessly execute an edge without any trading errors. Meaning, to execute consistently, objectively and peacefully without hesitation, internal conflict, doubt or fear.
Trust that each “edge” we use has a statistical and probabilistic advantage in the future horizon, trading timeframe and lifestyle we have chosen.
To expect or predict what will happen in a future timeframe, based on what has happened over a certain passed timeframe, merely self-sabotages us to be able to execute our “edge”.
Our human minds are hardwired to want to know. Defaulting to our human hardwiring does NOT work if our objective is to be a skilled, competent, peaceful, successful active investor.
If we desire this objective, then we have to “step into a process” (one of Mark Douglas’s favourite phrases) to redefine, reframe and retrain how your mind works with respect to trading financial markets. This is the Skills Acquisition Plan provided in The 4-Week PROCESS + MINDSET Training Intensive (or The Exercise on page 185 in Trading in the Zone).
So where does this leave us with trusting an (our) “edge”? An “edge” is, by definition, probabilistic in nature, i.e. it is not certain.
Sooner or later, we HAVE to trust an “edge”, some “edge”. Otherwise, we’ll never achieve consistency and have the ability to “flawlessly execute” our “Edge”.
What do YOU have to do to trust any “edge”?
Simply read a paragraph on a website about the performance of 3 of an edge’s metrics? Or 6 or 7 metrics. And which ones?
Were the results achieved in backtesting? Or live trading with money at stake? If live trading, with how much discretion? (Discretion and subjectivity have a very low probability of being repeated or replicated into the future by somebody else.)
Over what period was the backtesting? And the live trading with money at stake?
Covering what market conditions? For backtesting and live trading?
In conclusion…
By default, we are discussing mechanical trading systems here.
The great majority of traders don’t use mechanical systems. They use subjective and discretionary decision making. Understand that 70% - 90% of traders lose money (mentioned in the Training Intensive). Nearly all of them do not use mechanical systems. Their benchmark is not a Total Return index, it’s the $0 horizontal line along the bottom on an equity curve chart. They just want to be profitable…
What we are discussing here is attaining mindset skills that can ONLY be achieved by trading with a mechanical system. Not my words, Mark Douglas’s.
So, which comes first? Trust in a mechanical system or self-trust.
You can post your answers to Dave’s post from today here: Thought of the Week
Good discussion Gary - I suspect this will be my last comment as no doubt everyone has heard enough from myself.
I guess this is the crux of the matter and these findings you share needs to be impressed upon new starters - especially to assist with natural human expectations which have been derived from the backtest.
The ETF strategy I quoted is an ‘All Weather Approach’ (60% Growth / 40% Defensive) so probably can’t be compared 100% with a Trend Following Equity strategy. But for me it’s all about finding something that is easy to let run with less activity - although there are rebalances involved.
Yep - someone emailed me about this a few weeks back and I replied that I could supply it. There hasn’t been any deliberate attempt to under trade the capital from my end. I just place a BUY order (by $$ - not number of shares) for the amount that spits out from the BC signal once you click trade. I then email myself the $$ trade, ticker and after acting on it the next day (transaction times vary though as I don’t have access to MOC orders - actual trade time of day depends on meetings / travel etc), I then adjust the actual number of shares purchased and average price paid so the position sizes should be thereabouts.
Capital has been added though.
I assume the Financial Statement is the file you would want?
Haven’t heard enough from you, you can post as much as you like.
By definition, freely offered opinion is motivated by some degree of disappointment that contains some degree of confusion seeking an answer to improve. Clarifying confusion requires analysis of data and a method of explanation. That is, evidence based rather than merely a subjective counter-opinion, to the originator, and all who might have a similar opinion even if for a different reason.
Transparent discussion about assumptions, outcomes and judgments leads to answers, from which all can gain knowledge, attain skill and grow their perspective.
If one’s perspective of the environment in which they operate is not sufficiently big enough, this can lead to evaluating outcomes from a level that is not yet at a high enough level to judge outcomes that are in one’s own best interests.
An example is a young talented footy player not accepting their senior coach’s personal growth plan and game plan for the team. And then going down a path of “reinventing the wheel” with trial-and-error.
Of course, accepting the coach’s plan doesn’t guarantee the player’s desired outcome, but it does carry a higher probability for improvement in execution and consistency.
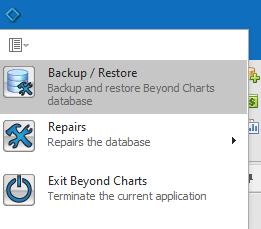
To eliminate position size as a possible cause, or Exposure % calculation error due to capital injections and withdrawals, we’ll need to access your Beyond Charts database. Financial Statement will be prone to errors trying to confirm what we need to.
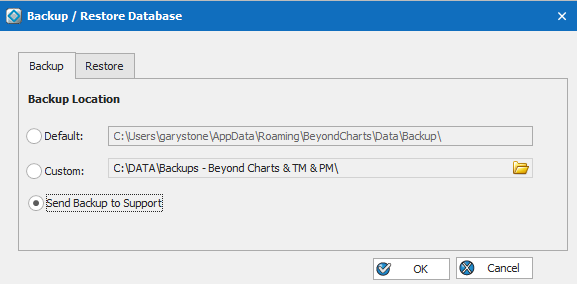
This is easily done by clicking on the tiny icon in the top left corner of Beyond Charts and then…
Yep - all valid points thanks Gary and Ok I will make 1 further comment then.
As I intimated earlier, the pure quantum of transactions generally (161 now) - along with a win rate down in the 35% - 40% range is not really the journey I want to be on - especially with a circa 6% CAGR. So I guess with the sporting analogy, the football coach has a bloke in the team that wants to play basketball!
As of today, the portfolio is already back in a 12% drawdown since the April peak and have given back most of the run from October 2023 (when it was also taken out of several positions at their lows COH REA CBA and I think CAR). It’s missed the banks and WES which have had good runs - selection bias again.
After using the system for at least 5 years (so I have given it a fair go), it doesn’t win often enough (for me) and the win sizes aren’t really big enough to offset regular losses of 9%+. With lots of transactions comes lots of brokerage and friction / slippage. You can BUY/SELL at the wrong part of the session and your CAGR is negatively affected.
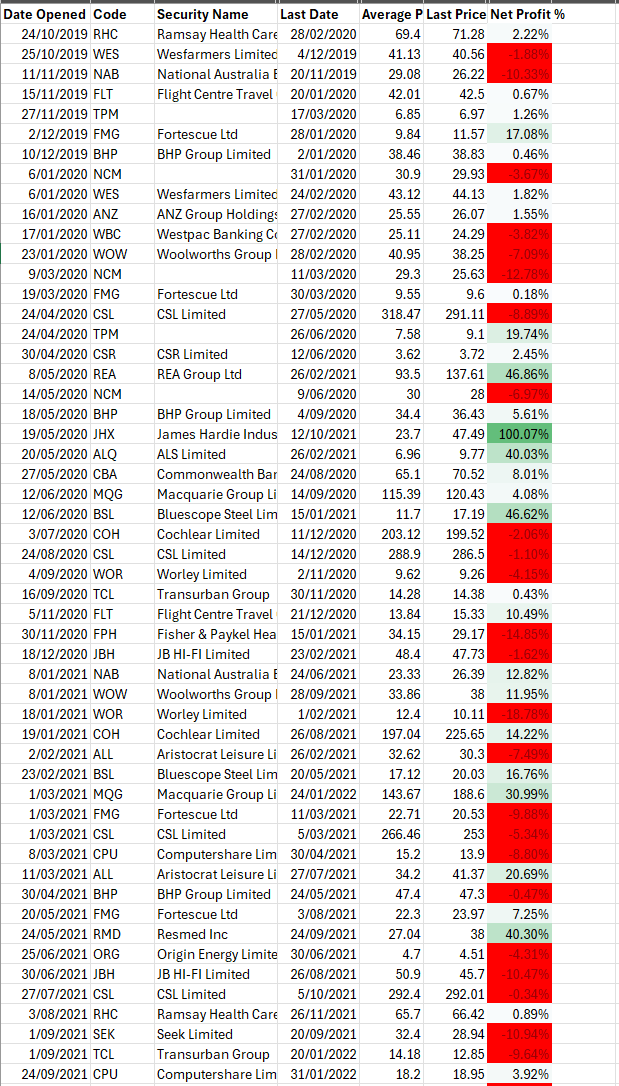
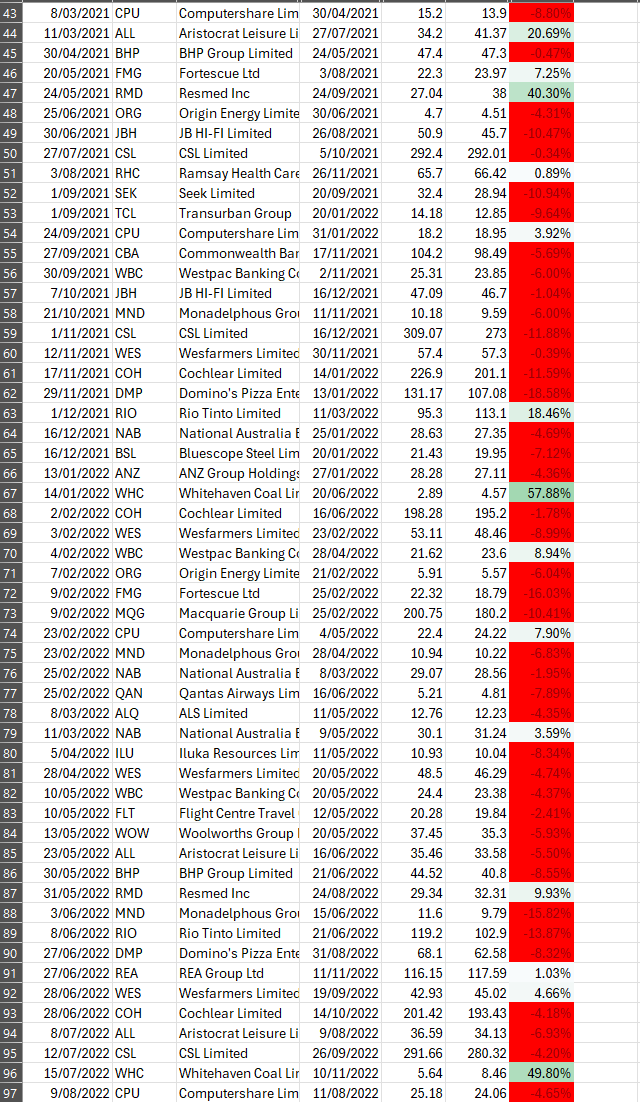
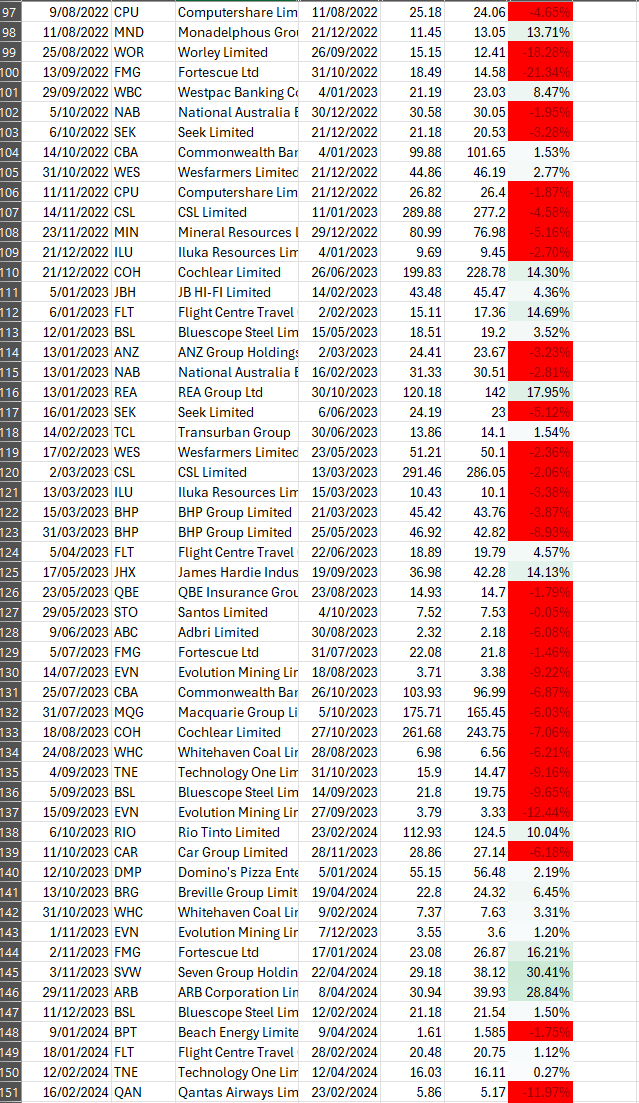
Brokerage now totals circa 4% of capital amount so quite a drag too. Just take a look at the number of transactions.
So the benefit of the system (as I see it) is solely ‘reduced drawdown’ versus the index ETF ‘Wait and Win’ approach (that I don’t hear much about anymore) but this risk can be managed through alternative systems that have far fewer ‘pain points’ and which don’t involve specific stock risk / selection bias. Maximum Drawdown at circa 11% for Mixed Asset strategies is attractive too.
With my monthly systems, I don’t even look at them until the last trading day of the month so for me that appears to be the way forward - otherwise I will remain in the trading wilderness trying to adapt to systems that don’t suit me.
My US Monthly system is plus 26% calendar year to date so it’s not like you have to miss out on returns by being less active. The All Weather (also Monthly) is only plus 14% YTD but it’s a far smoother ride.
So in summary, this isn’t a dig at the business as I know SWS want their clients to succeed but if someone said to me this is how the journey would look, I wouldn’t have commenced.
But that’s just me.
Sidenote: All Weather (29/5 session) is plus 0.4% vs SWS negative 0.58% in a weak tape.
As a trading coach, there is much for me to unpack from your response. Which I’ll do in a C&G Training Webinar rather than write lots more words here, on top of all those written above in this thread.
All your stated metrics in this thread are valid observations.
However, there are other metrics and observations about SPA3 Investor that you personally haven’t experienced over different periods that you have overlooked or omitted because they don’t support the case you have put forward. You have access to these in the ASX & US public portfolios and in the Simulator. I’ll keep some of these for the webinar.
I’ll make one further comment here and leave the rest of my response to the webinar.
My comment is this: Because of your experience and outcome over this period, which is your truth, compared to what you originally expected, you are disappointed. And, as a result, you now ‘know’ for sure what will happen over the next 5 years with SPA3 Portfolios and with the other ‘systems’ you follow, mechanical or discretionary.
You also ‘know’ for sure that you would have done better with the money that you did invest in your SPA3 Portfolio over the last 4 years and 7 months.
The date and time of the webinar will be sent via email to all SWS members and will be published here on the forum. All attendees will be able to ask questions then. The recording will be available for all members.
The recording of Gary’s webinar, “How To Trade Properly”, is now available for viewing.
This webinar is a direct response to the comments posted on this forum thread, and is a must watch for every trader/investor who wants to improve their skills.
If you have any comments or questions relating to this session, please post them below so we can continue this great learning experience.
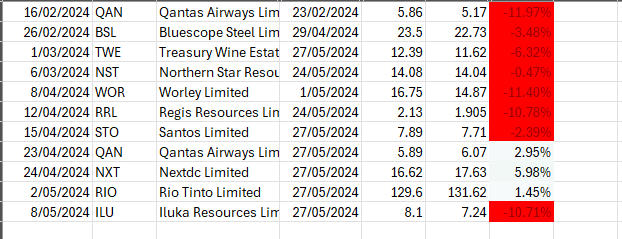
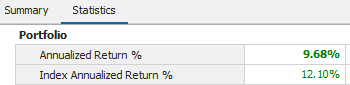
Let’s restart this forum thread with some annual results. I commenced an ASX Investor EW Stocks PF (10 positions) on 1 July 2023 with $50k and added a further $50k on 1 Feb 2024. I acted on alerts as they arose following my Rules without any subjective input - a BIG WIN.
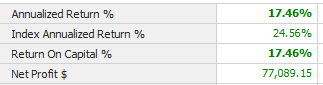
My PF annualised return was -2.9%, 15 percentage points lower than the index 12.1%, a significant underperformance with a big divergence in May and June. In a mostly sideways year this financial result is disappointing when compared to the index but not unexpected. The win rate was a low 27%, payoff ratio was 2.3 and expectancy negative.
There were 40 closed trades and only 5 open positions at the EoFY. I recall that it wasn’t until the 18th closed trade in Dec that I saw my first profitable trade but I kept reminding myself that we cut the losses and run with the winners.
I accept that this is only the first 12 months of a 5+ year journey seeking the ‘long run edge’.
For comparison, the SPA3 ASX Stocks public portfolio at EoFY after 8 1/2 years has returned 11.4%, 2.5% better than the index, win rate 38%, payoff ratio 2.5 and expectancy 0.33.
Anyone else willing to share their 23/24 experience?
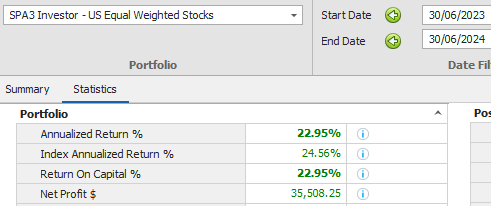
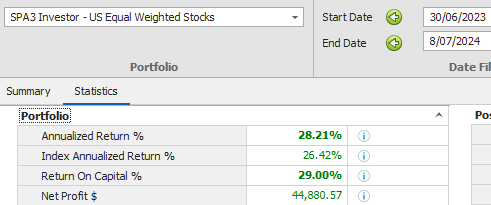
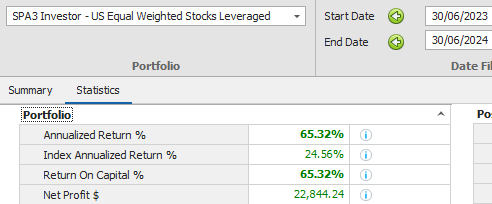
I don’t have any exposure to the ASX due to its current choppy nature, but I’m happy to publish my US Equal Weighting results. It won’t be a like for like if that’s what you’re looking for.
I think that’s certainly relevant. It’s the same methodology and process in a different set of trends.
Bruce,
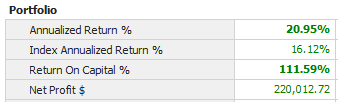
Contributing on this Forum as a trader rather than as an SWS staffer, I’m happy to post the results of another non-public ASX SPA3 Investor portfolio that I trade with another broker (part of my risk management plan).
I assume from the 12.1% growth in the XJOA that your end date was 30 June 2024, so the Australian FY only.
I trade 7 open positions in this particular ASX SPA3 Investor portfolio. That takes a little more risk due to slightly larger positions.
Comments:
This portfolio was a going concern as at 30 June 2023. This will make a difference when comparing performance to a portfolio that starts from scratch on a given date. Especially over a short period of time.
Like the SPA3 Investor Public Portfolio it was not fully invested as at 30 June 2023.
Total trades for the year was 25 compared to the ASX PP of 41
I run 2 equal weighted portfolios with CFDs My statistics for 2023/4 financial year are
ASX -11%
US +40%
Since 2016 when I started the portfolios
ASX +9.75% pa
US +14.74% pa
At various times these have reversed with Aus doing better than US but it moves around as markets do
I don’t worry and just keep executing as I believe the edge works out over time
Nick, Gary and Wakefield - thanks for your posts. It’s interesting to see the range of results in other markets, no. of positions & leverage etc and how others are travelling on this journey. Yes, my reference was to the Australian FY. Apologies if that was unclear.