Maximum drawdown

Jermayne,

I won’t cover this in the Supplementary C&G tomorrow. as this functionality is part of the Simulator which will be in the next version of Beyond Charts. A second round of Alpha testing has just started before being released to Beta testing with a small group of customers in the near future.

Ivor would have taken quite a few hours to do this back test. The Simulator will conduct this back test in a few minutes.

I was addressing the point made by Philip Baguley above.

so given the apparent success of the system why would you introduce them?

If you read my posts above, while you have had success with this system I have not. I am down from my starting equity > 10% after 15 months of using this system. I am currently in a > 20% drawdown.

Many people blame “poor market conditions” but the XAO closed today at 7369 which is off 7% from its all time high of 7924. During the time that I have been with SPA3 the market has moved ahead 7% and my portfolio is down > 10%. That is a 17% underperformance in 15 months.

I attach my SPA3 Investor equity chart to make the point.

Hi Ivor,

As mentioned, I’d be more than happy to look over your portfolio to see where any discrepancies might have occurred over the entire portfolio history.

You did send in a copy of your portfolio in November which we still have, when we ran a very raw version of a simulation over it. With your permission we can use the first trade date of that portfolio to produce a simulation of the trades that should have been taken in that portfolio over its life up to last nights close.

We can then create your equity curve as it should be for comparative purposes to see if there are any anomalies……just to be 100% sure.

If you’d like me to do that, please let me know.

In terms of a single Index ETF like STW ($XJO) we know in a rising market that Buy and hold will typically outperform the use of timing, in the medium term. This occurs because of the lag that can happen when we get volatile choppy markets that can produce multiple short lived trades as new trends fail to fully develop, which can create realised losses.

Buy and hold by comparison avoids those realised losses during those periods.

However, over the longer term of say 20 years+, timing of an Index tends to beat Buy and Hold simply because we are likely to experience several large Bear markets during that time.

Many members will have seen the lesson on this in the Education Centre. Buy and hold will wear the full brunt of any downturn, whereas timing will be much less exposed.

This is at the core of Sequence of Returns Risk, and why as a stage 2 or stage 3 investor we use timing to help to reduce the impact of those large bear markets.

(Remembering that it takes on average between 6-8 years for market to reach their previous highs, there is a time cost and a financial cost that we want to avoid in later life in stages 2 and 3).

As Gary mentioned you’ll be able to use the Simulator to explore what might happen if you chose to invest in a single ETF from a universe of 1,2,3,4,5,6,7 or 8 from the SWS ASX ETF Universe along with other permutations across the entire SPA3 Investor Universe that you have data for.

You’ll also be able to investigate the impact of using a “High Market Risk” filter when executing your own portfolio whether it be a stocks-based portfolio or an ETF one. This will also provide some great insight for members that might be considering the merits of using that type of approach.

Ivor, in your time frame, starting 1/01/21 to date I am showing negative 4.09% return which is about 14% under performance to the market and my maximum drawdown is 26%; however, the point is that this is too short a timeframe to draw any conclusions about the system. I am not worried as I have seen greater drawdown before in the nearly 6 years I hace been operating the system and am confident that over time the edge will assert itself; you have to think in years not months.

Is there a date for the Simulation tool as I am sure a few will backtesting / checking portfolios with an index filter! :slight_smile:

Hi Nick,

The Simulator is imminent and will be available shortly. Stay tuned and keep an eye on your inbox for an announcement.

Regards,

David.

How is everyone’s portfolio going with the market struggling? I have really come back to the field - the equity curve topped out in August 2021 and has been declining ever since. Better than the index but feels a bit disappointing for the effort and stress expended.

Early days though - this is just over 2.5 years and the last 12 months or so has been very similar to 2018.

Going to be an ugly end to the FY - does feel like a LOW is close (Hopefully :slight_smile:

Awful returns to date. I’ve been burnt too many times with this app… how much money and aggravation do you have to go through.

Hi Michael,

The last couple of years have been quite tough with heightened volatility really testing one’s resolve in the markets.
I’d like to investigate your situation and results a little further to see if there is anything obvious that might be causing the returns mentioned.
If you could export your SPA3 Investor Portfolio and email it into support@sharewealthsystems.com we can take a closer look for you.

Hi David

Would it possible for Gary to do a session on the performance of SPA investor (ASX equal weighted) looking at the underperformance of the system over the last 2 years, the returns required over the next 3 years to bring the system back into outperformance (within the stated goals of 3-5% pa rolling over a 5 year period) and to highlight where that quantum of returns (circa 10+% pa outperformance) have been achieved over the life of SPA3 Investor. I think many of us want to be reassured of the long term performance of the system
Thanks

Hi Nick and others,
I agree the last couple of years have been testy, but I still have faith in the system, and as I am coming up for 5 years in Sept. this year, I am very close to running 5% above the index on my Spa 3 Investor ASX equal weighted portfolio, even though I am back to 11.7% return from about 16% 5 months ago.
I am very happy with 5% above the index which is what the system is supposed to produce. I try to run it as best I can, but have made the odd mistake along the way, but try to learn from it.
Hopefully that helps, and things turn around for you.
Regards,
Kym

Yes it’s really tough. RIO MND have been really hard to stomach and the giveback in WHC is just a symptom of the market we are in. I was banking on WHC covering losses too. These are results closed since early February after the initial January sell off so the ASX has generally been pretty awful. - just have to keep ploughing through. This is probably a better table where the stock and results are provided.

Hi Paul,

The first 2 years of the ASX Equal Weighted Public Portfolio underperformed the ASX200 accumulation index. ($XJOA)

To highlight the various periods of relative performance between the benchmark index ($XJOA) and the SPA3 Investor ASX Public Portfolio please see the Base Reference chart below.

The panel at the base of chart highlights periods of outperformance of SPA3 Investor when the line is sloped upwards.

Note that this can also occur in times of market declines when the SPA3 Investor portfolio is largely in cash (eg during COVID).

Trend following systems have a long tail meaning that they tend to have relatively less large winning trades compared to smaller profit and loss trades. It’s just the nature of trend following.

SPA3 Investor is not an Absolute Return strategy which means it will not produce positive returns when the market is falling.

As a “long” only trend following strategy it has a high probability of outperforming its Benchmark by 2-4% p.a compounded over a full market cycle, encompassing both bull and bear markets.

I know it’s pretty specific but that ALL has been frustrating of late - system keeps buying the failed break then selling support. Anyway onwards we grind. Anyone else get caught in that CPU downdraft? Bid was 24.5 then 5 seconds later my market order was hit at 24.06… #slippage

Best way to avoid that is to put on before 10.00am your order either at market or below the indicative opening price and you will get sold on the opening match off. Providing you do that consistently, it won’t make any difference to your edge.

Interactive Brokers let me place market orders before open but CMC don’t so I am stuck with a LIMIT order although they offer an ‘algo’ option to get the opening price but you still have to place a LIMIT in there. CPU’s opening price was moving around a heap before open so it was hard this morning but I get what you mean

It could be a bit risky (I don’t do it) but to guarantee getting the opening price, just put as lower price as you could bear to risk.

How is everyone going with DMP? It’s certainly one name that would have been good to avoid! Sheesh.
It does invite the question regarding additional research / drawdown minimisation that Gary spoke about last week - will any research be done with taking LONG trades when price is trading below all MAs (ie 20 50 200) for a certain number of days or similar. I am not sure of the exact metrics one would use but a winrate when trading names against these headwinds would be interesting to know anyhow. Chart attached - always easier in hindsight of course!

Hi Nick
DMP would trade better using weekly chart

Nick et al,

As mentioned in the Supplementary C&G last Fri, SWS has indeed been deep in research for a few weeks now to mitigate the drawdown that is occurring with SPA3 Investor portfolios, especially with US portfolios.

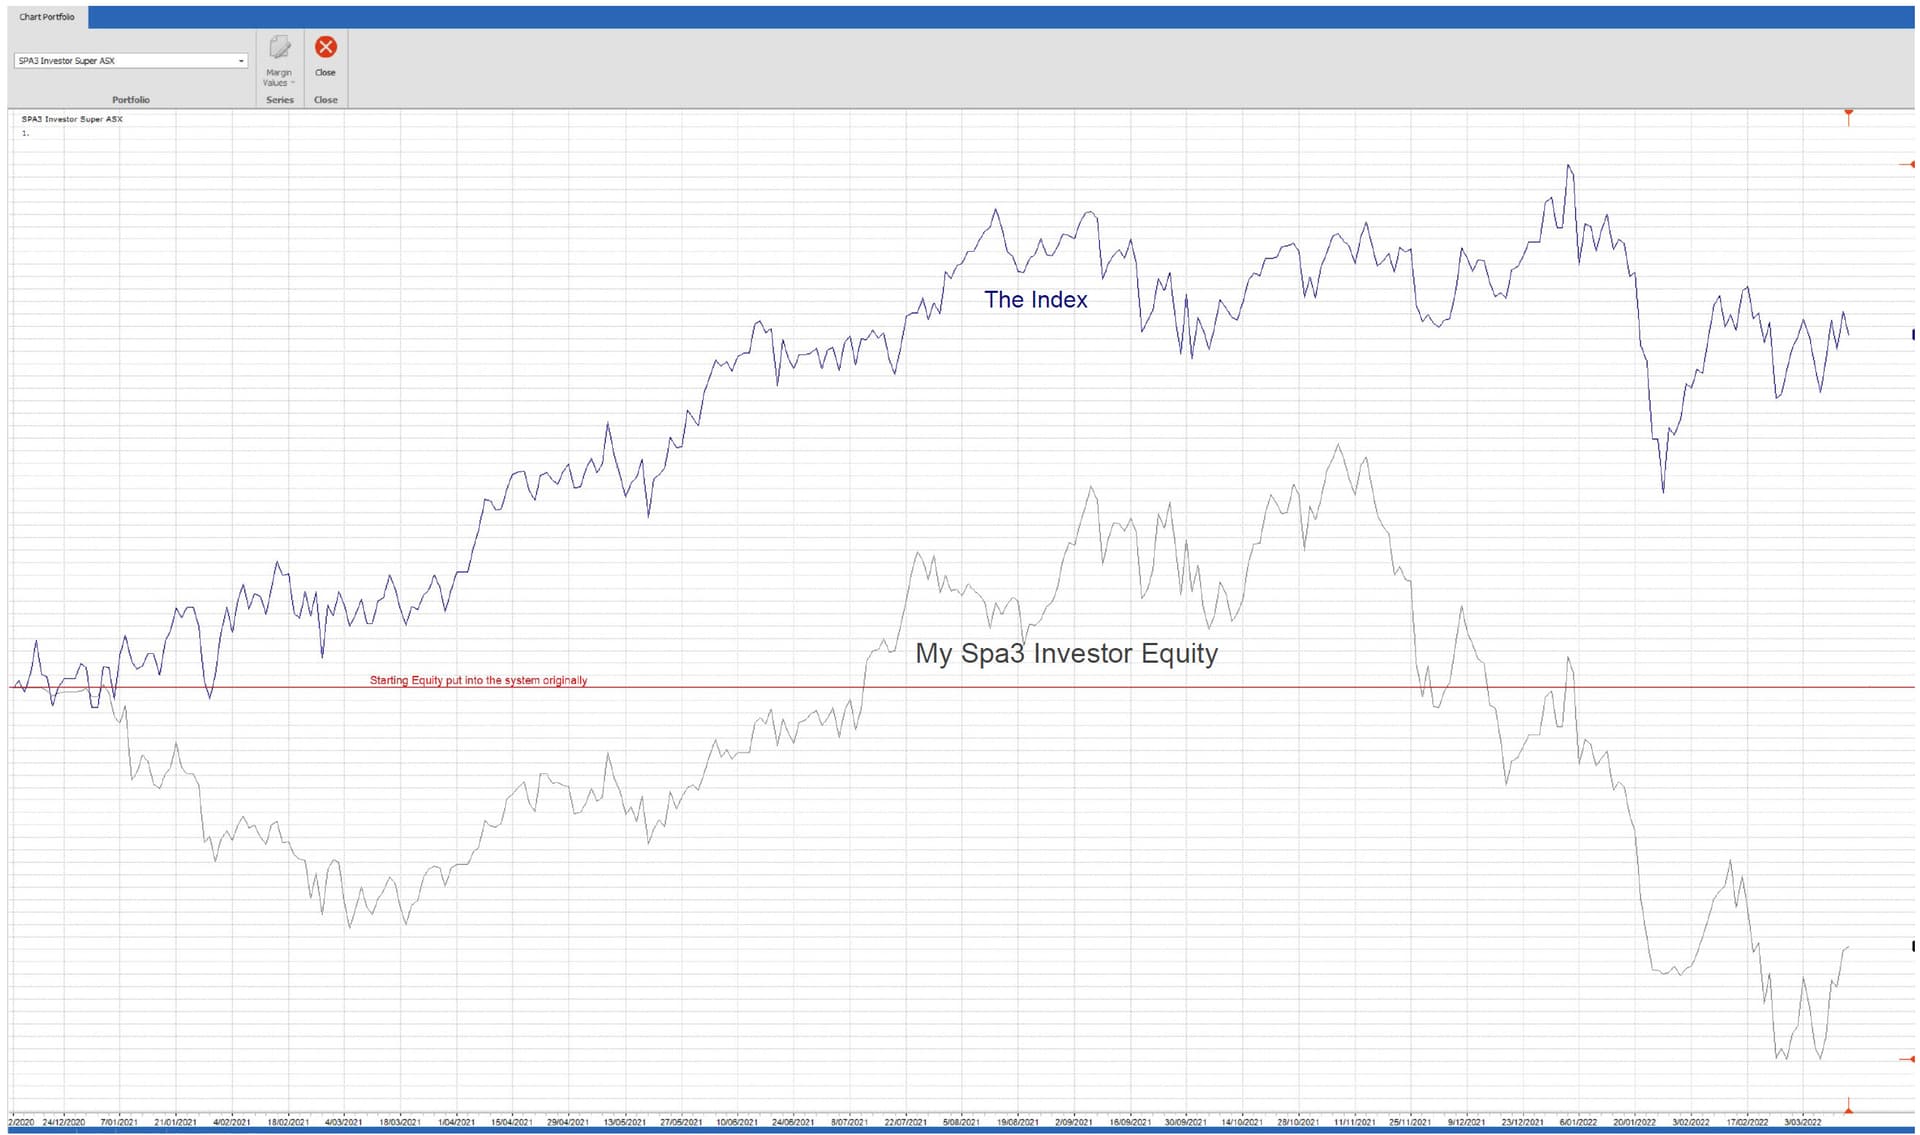
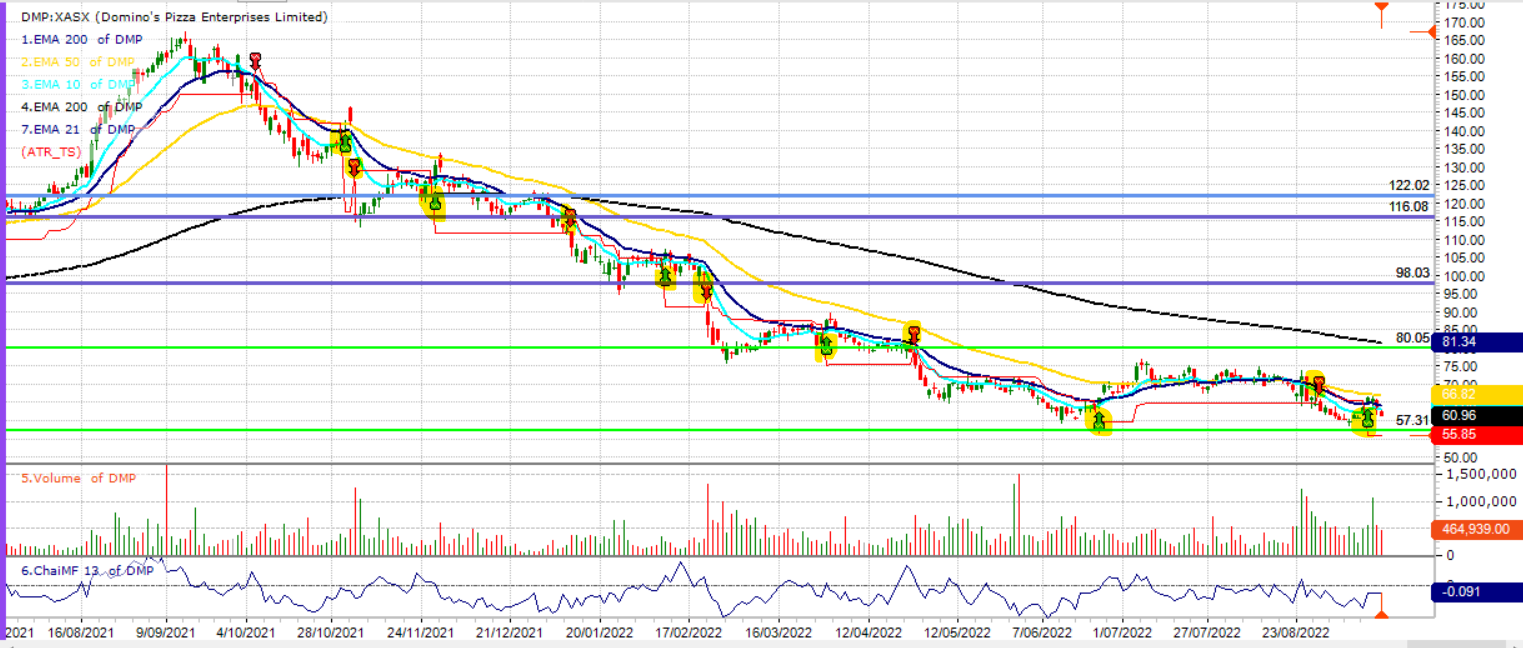
As is well-known, trend-following systems struggle the most in long-lasting sideways and slow-falling markets. As has occurred for 13 months now on the ASX and 11 months on the US markets.

Long, slow, deeper (>20%) falling markets are fairly rare (haven’t had a similar market to this since 1989-1990 and 2000-2002 in the US - 2008 was 2 sharp falls) and, as such, presents a brilliant dataset to research how to best handle them with the current universe of stocks, in preparation for the next occurrence. Which may or may not be sooner than the gap between the last occurrence and this one…

Research avenues that SWS is working on with SPA3 Investor:

  1. Risk Management: revising Market Risk variables to use longer term Index timing that is better suited to a longer-term system such as SPA3 Investor.
  2. Money Management (Position Sizing): incorporating %Risk (same as SPA3 Trader) position sizing alongside Equal Weighted.
  3. Method: adding a Filter to individual stock timing (e.g. SPA3 Trader uses RSC - Relative Strength Comparison).

Risk Management: a new set of variables has been researched to determine Market Risk timing. Early results are promising to determine when to use BAPs and when not to, and when to reduce exposure by reducing the # of open positions.

Method: Various filters have been and are being researched, including RSC, various Moving Averages and other concepts.

Researching price action in the financial markets is a tough gig. What seems to work over a short period of time over a small sample rarely works as well across multiple market conditions over a longer period and larger sample of trades.

For a good explanation of researching, please read page 152 of my short-book “15% Per Year in 15 Minutes Per Week” and the 1 or 2 pages leading into it. The short-book is available in the Education Centre to all members in the SPA3 Investor and SPA3 Trader courses.

Reducing drawdown with SPA3 Investor on the US and ASX markets is the most important and urgent project in SWS at the moment and has my full-time attention. However, we are are mindful not to stifle returns in the process.

There are already improvements that we have identified but would prefer to complete researching a few more concepts that we have on the list. Whilst research is always “how long is a piece of string”, we are fully aware of how important it is to make the most of this fairly rare period of market conditions and to implement the necessary modifications to the methodology, which we are fully aware is a “big thing”.

Whilst Wealth Lab is used for most of the research, concepts that work well-enough (it’s nearly always degrees of… and seldom absolute) will be added to The Simulator in Beyond Charts.

When we get there, I will present the outcomes in a special Connect & Grow Webinar.