Maximum drawdown

what is the definition of a secular leader?

If there is a 50% chance it will drop 80% then there is also 50% chance that is will not drop (almost like red or black at the casino). And by when? Its like anything can happen.

I think this rule is too vague to follow.

Hi.
Interestingly I did not achieve these numbers at the open with market orders set last night. The parcel size and time of order may effect the price achieved.

Jermayne got:
FMG 18.70
FLT 18.46
MQG 180.19

I got
FMG 18.53
FLT 18.10
MQG 179.77

Cheers,
Lindy.

I am not saying you have to follow it - merely that a trader should be open to the possibility that leaders can ‘correct’ (i.e. fall) a long way. The stat is 80% of market leaders fall 50% at some time and 50% can fall 80%. It keeps me from clinging to a narrative just because they are ‘blue chip’ or a market darling - call it what you like. Pull up a chart of Appen as an example.

That said, I am the last bloke you should be listening to on here - it’s just an interesting stat from Minervini that I keep in the back of my mind though.

Thank you, Nick.

For my ASX EW satellite portfolio, I allow up to 9 open positions.

I based this on research presented by Gary on 21 February 2019. Here is the link:

https://learn.sharewealthsystems.com/courses/369200/lectures/24469367

Best regards,

John

Hi,
Choosing which time of the day to buy into a stock or sell is a difficult one Lindy. I work on the philosophy of you win some you lose some, but with sells, I look at the bloomberg futures indicator and if it suggesting the ASX market is going to open down (quite often after US is down) I sell on open, but if it is suggesting the ASX market is going to rise, I leave the sell until around lunch time to possibly gain a few more cents per share. With buys it is the opposite,That probably works more than 50% of the time for me but not always. That’s assuming you can look at the market during the day. Hope that helps.
Regards,
Kym

Hello, Here is an update on this EXTREMELY SMALL test.

Test of 11 O’Clock plus Trailing Stop Trade
Symbol Signal Date SWS Sell next day Close StopLoss Date StopLoss Sell Date Sold @ Diff to SWS % Diff
FLT 24-Feb $18.18 25-Feb $17.74
FMG 24-Feb $18.60 25-Feb $18.42
IVV 24-Feb $594.21 25-Feb $593.40
MQG 24-Feb $180.02 25-Feb $178.65
Jermayne Williams Intra Day Sell sold between 10.29 and 10.30AM
Symbol Signal Date SWS Sell next day Close StopLoss Date StopLoss Sell Date Sold @ Diff to SWS % Diff
FLT 24-Feb $18.18 25-Feb $17.74 25-Feb $18.46 $0.28 1.54%
FMG 24-Feb $18.60 25-Feb $18.42 25-Feb $18.70 $0.10 0.54%
IVV 24-Feb $594.21 25-Feb $593.40 25-Feb
MQG 24-Feb $180.02 25-Feb $178.65 25-Feb $180.19 $0.17 0.09%
Lindy Shepherd at the open with market orders set last night.
FLT 24-Feb $18.18 25-Feb $17.74 25-Feb $18.10 -$0.08 -0.44%
FMG 24-Feb $18.60 25-Feb $18.42 25-Feb $18.53 -$0.07 -0.38%
IVV 24-Feb $594.21 25-Feb $593.40 25-Feb
MQG 24-Feb $180.02 25-Feb $178.65 25-Feb $179.77 -$0.25 -0.14%

Hi all

I have been following the discussion around drawdown with interest, as my portfolio has not suffered much recent drawdown at all. My largest drawdown is 9.1% from 11-Mar-21.

I have compared my portfolio to the publicly traded portfolio from 8-Jun-20 (after Covid crash and some capital injections). I normalized & plotted the portfolio valuations to allow direct comparison. The two portfolios have tracked each other closely, until around the beginning of Nov-21, when the public portfolio has gone into significant drawdown . Hopefully the plot is shown below.

I do not generally take BAP trades when the market is “high risk”, although I do take new trades. Otherwise, I follow the system as closely as possible. So I think the reason for difference is simply the sequence of trades, and the “luck of the draw”.

Experience tells me that we will all sooner or later get a sequence of painful loss trades, just as there will be a series of winners.

Regards

Phil

Hi Phil,
Very interesting. How to you classify the market as " high risk", and when you say “generally”, do you have any rules around that?
From you equity curve it is apparent to me that you wouldn’t have experienced nearly the extended churning that we have had which is why so little drawdown.
Cheers.

Why is that? There are two possibilities. Are you suggesting that I am not following the system properly? Or are you suggesting that my >20% drawdown should somehow be interpreted as a good thing?

I have sent my trades into your support team and it was confirmed that I have been following the system rules correctly. They were run through the simulator that you are developing.
When I joined SPA3 I joined with a friend. He also started trading with spa3 investor at the same time as me tells me that his drawdowns are even larger than mine.

As of now the market is up 0.82% but my portfolio is negative.

If your reference to recency bias refers to the last 15 month since I started with SPA3 then it does.

you are comparing your outcomes with SPA3 Investor to alternatives during a negative market cycle.

The alternatives that I am comparing to is the whole Australian Market. I am not cherry picking alternatives. I am comparing SPA3 over the last 15 months and over that period the market has not been in a “negative market cycle”. It has been negative recently but you cant blame the market. My portfolio performance has been significantly worse than the market.

From what you have presented SPA3 has performed well in the past. For me and my friend it has not performed well in the last 15 months. With regards to other investors if they have benefited from past out-performance it is a lot easier to return some profits during a drawdown. But my current capital is well below my starting capital. My portfolio has significantly underperformed the market in the past 15 months. Given my experience I fail to see the “beliefs about SPA3 Investor”.

At present I need a very good next 12 months just to break even! I also need to make >25% return on what I have left in my portfolio just to get out of this drawdown.

My comments, and others, by no means make what you are feeling right now any easier.

You are correct on that point. They actually make me feel worse.

Ivor

Ivor,

Have you listened to the C&G session that I presented last Wed? What I’m about to say will make far more sense to you if you have. And if you have and what I’m about to say still doesn’t make sense, then listen to it again.

I’m not suggesting either of the 2 possibilities you have stated.

What I am suggesting is that there are many many others who are also experiencing similar %age drawdown to what you are, some a little less and others even more. Indeed, I am one of those in one of the US Public Portfolios.

However, their (and my) feelings are very different to yours. That is, their truth (and mine) is different to your truth. Not wrt to the %age drawdown, but wrt the way that they are framing and positioning this drawdown in their minds compared to how you are.

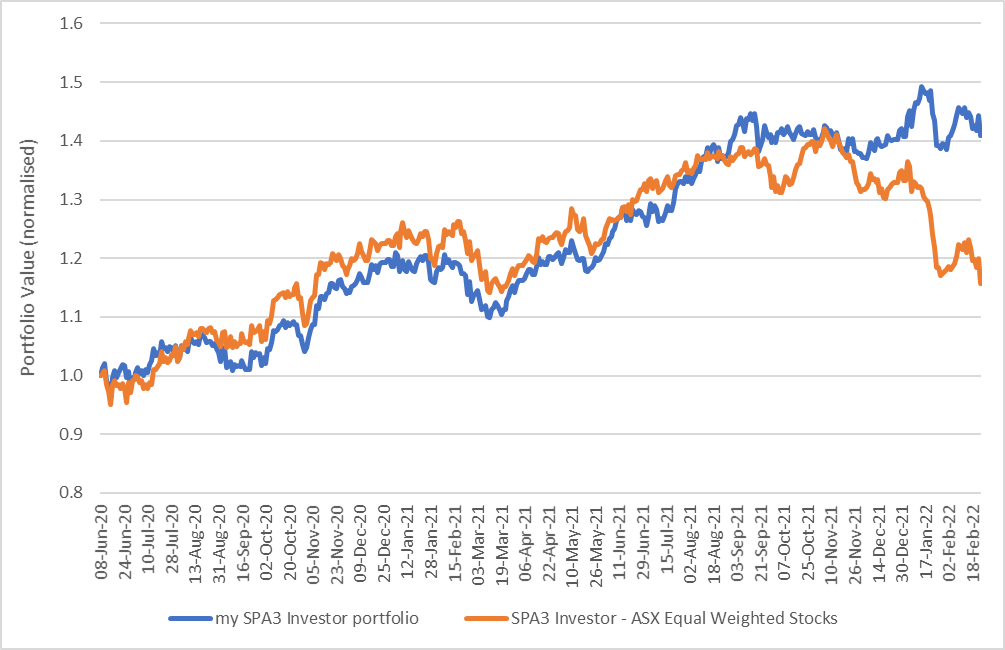
To repeat, same / similar performance over the last 15 months, different feelings and mindset.

WHY is that ? Because they have a different perspective and understanding that isn’t ONLY determined by the last 15 months (actually about 4.5 to 5 months of the last 15 months).

They have either experienced or sought other input and evidence to help them frame the performance from the last 4.5 to 5 months (ASX) in a way that best positions them for their best execution in the future.

Do you really think that in nearly 27 years of business you are the ONLY SWS customer who has experienced what you are experiencing right now?

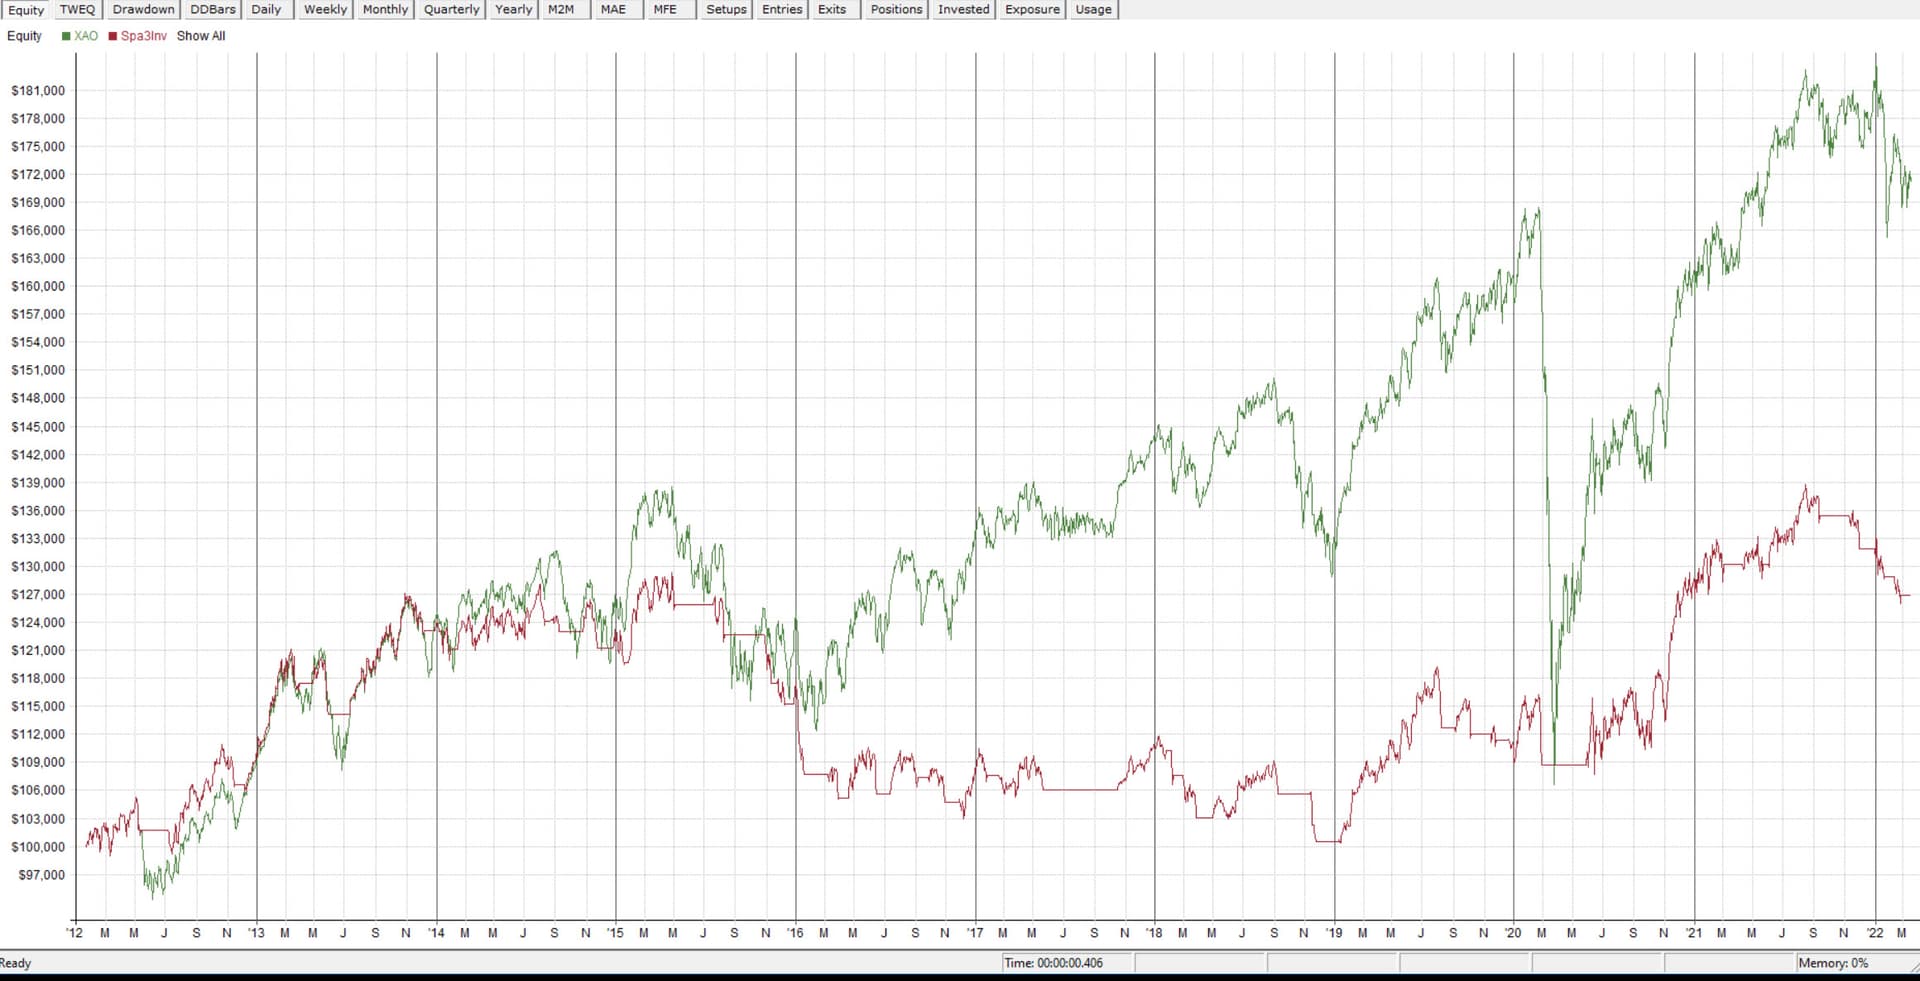
It has happened so many times since we released our first mechanical system in Oct 1998 and then started publishing the SPA3 Trader equity curve back in 2001, just over 21 years ago! .

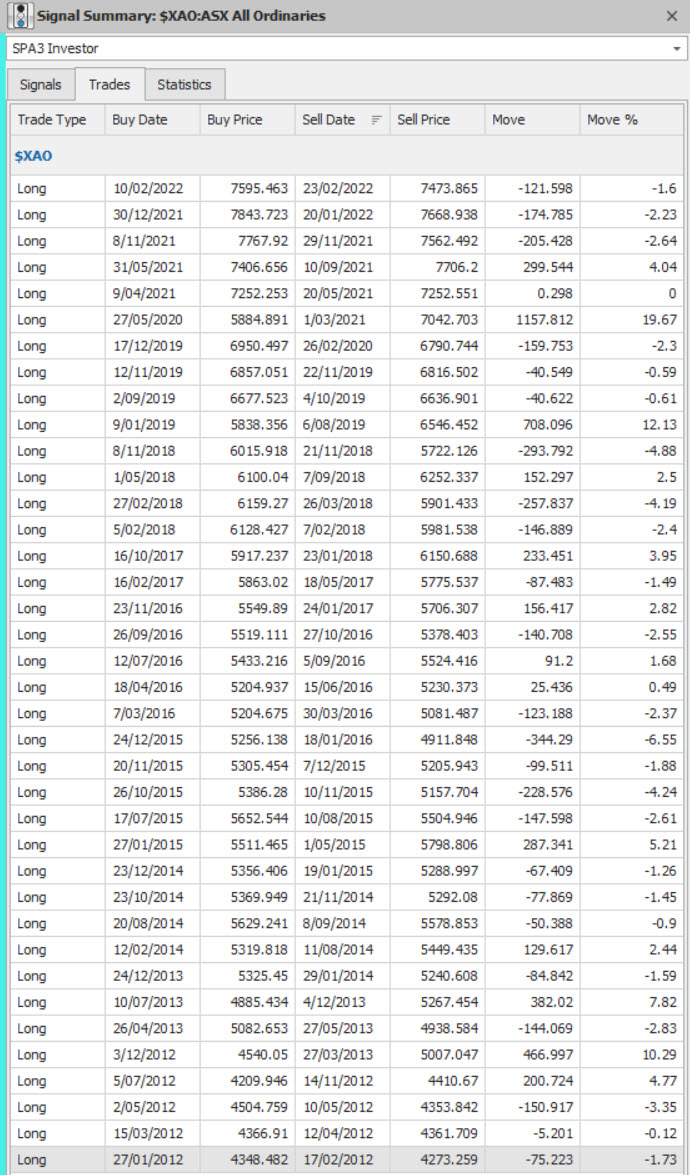
Similar words to yours have been written on our Forums in 1998, 2000-2002, 2006, 2007, 2008, 2010 -2012, 2014/15, 2018 and now in 2022. Basically every market hiccup of more than a few %. And the SWS team has fielded direct questions such as yours via email and phone.

EVERY TIME others have felt what you are feeling now, the mechanical system equity curves have gone on to achieve new all-time highs in their portfolio values.

We’ve just never known WHEN the new all-time highs will occur. But occur they have.

One thing is for sure, a new all-time portfolio value high can ONLY occur for those who stay the journey.

Years later, some are still experiencing what you are now. They are the ones that stopped executing. Which has probably left their portfolio values in drawdown forever…

I can’t guarantee when another new all-time equity peak will occur in the public portfolios, or even that they will occur at all.

All I can do is keep executing to allow the Edge to play out in the market and to ensure that my mindset is in the best possible place to do that. A bit like life.

With regards to other investors if they have benefited from past out-performance it is a lot easier to return some profits during a drawdown.

This point has been much debated by existing customers over the years. Indeed, many have concluded that having a drawdown in portfolio value BEFORE a runup is the better order (not necessarily the easier) from which to learn, than the other way around. As with any sample, that is NOT a 100% agreed upon point, but it does show that the point you trying to make is not necessarily the truth for everybody.

Anyway Ivor, all myself and my team can do is try to help you achieve a similar investing perspective that we have helped others achieve over the years - one that works wrt to investing; or that others have helped themselves achieve on their own through the use of a mechanical investing system.

It certainly is not my intention to make you feel worse from posting my comments here, or in the C&Gs that I present. Merely to provide an insight that is different to what yours is at the moment. Hopefully one that helps you improve as an investor to achieve the success that so many others have over the big picture long term.

Regards
Gary

Hi Ivor,

The original simulation was performed on the start date of your portfolio and not from the date of the first trade recorded. This can make a difference purely because of the sequence of trades that occurred in between your portfolio creation date and the portfolio’s first trade.

I’d be more than happy to look over your portfolio to see where any discrepancies might have occurred over the entire portfolio history. Once the simulator is released you’ll be able to check this for your self.

Regards,

David.

Hi Ivor,

Firstly, let me acknowledge your concerns. It is a very challenging market at present, and we are all being tested. It is very frustrating. I recently commenced running a new satellite portfolio. From the get-go, the equity curve basically went into drawdown. The portfolio commenced on 9th Sept 2021 and as of close of trade last Friday the portfolio, including a couple of dividends received along the way was down 11.32% in just under 6 months. I could view this as a function of “bad luck” or a dodgy trading system. But this is incorrect in my view. I view it ias an adverse sequence of returns which is going to happen regardless somewhere along the journey. Put another way, I just got a run of losses up front, rather than after a peak in my equity curve. I could also get this a run of losses with a series of coin flips where I called H or T incorrectly.

Personally, I view this trading endeavour in probablistic terms, as Mark Douglas implores us to do in “Trading in the Zone”. To use an analogy, we (as in all SWS customers…) are the “House” at the casino, as we have a mathematical edge in our favour. It is simply a matter of executing consistently in accordance with the signals as they come. The mathematical edge will eventually play out in our favour over a large enough sample of trades. “The House” (say Crown Casino) will often have a run of losses on the roulette or blackjack table, but over a big enough sample of spins or hands, the edge’s positive expectancy will eventually play out rendering the House profitable in the end. Despite all the “glitz & glamour”, a casino is simply a mechanism to steadily transfer wealth from the punters to the house. While there is very little “glitz & glamour” for us, I view using a robust back-tested mechanical trading edge such as SPA3 Investor as a mechanism to transfer profits from the market to my portfolio, provided I faithfully execute according to the back-tested rules and my trading plan.

Viewing the equity curve of the SPA3 Investor Public Portfolio shortly after it commenced in Jan 2016 shows “ordinary” performance vs the ASX benchmark. But performance eventually improved as the edge played out over a large enough sample of trades. Similarly, SPA3 Trader has had periods where the Public Portfolio equity curve went into drawdown, but recovered handsomely later.

For me, it wasn’t until I read Trading in the Zone by Mark Douglas that I felt truly comfortable following the signals faithfully. It took me 2 reads of the physical book plus listening on Audible a further couple of times while walking the dog to finally “get” the lessons of Trading in the Zone. It was worth the investment of my time as it opened me up to what’s required from me to execute without hesitation & without question.

I sincerely hope this helps :- )

Regards,
Rob

Hi Ian

The market is “high risk” when the All Ords (XAO) is a closed trade when it is charted with the SPA3 Investor ATR_TS indicator, see chart below.

The strategy of avoiding new entries & reducing exposure when the market is high risk comes from my time using SPA3 Trader (or its previous incarnations), and other trading systems. Books I have read, e.g., Stan Weinstein’s Secrets For Profiting in Bull and Bear Markets, have also influenced this approach.

I say I “generally” avoid BAP trades, because I sometimes do take BAP trades when the market is high risk, although I am a lot more cautious opening new positions. It has to be a more recent new entry than when the market went “high risk”, and maybe some other (subjective) positives, e.g., the longer term chart, in a positive sector, fundamentals etc.

I am not completely convinced this approach is the reason for my lower drawdown, but I feel more comfortable sitting out with some of my portfolio in cash with these conditions.

Regards
Phil

I raised the question about market timing with SPA Investor recently, hopefully its something we can test with the new simulator as its always bothered me that SPA Trader observes MT but not Investor , yet same market and same time frame ( daily) . In my other trading I use the " Supertrend" on the index for MT, essentially its an ATR trailing / reverse , pretty much similiar to whats in use for signals in Investor today on individual stocks .

Hi Phil,
Thanks for your reply. Please check your messages.
Cheers.

Hi Phil,
I took your idea of using SPA3 investor as a market filter on the XAO and decided to backtest it. I did that by downloading the signals from Beyond Charts and used those signals as though I was trading the XAO.

Below is a screenshot of the signals that I used and screenshots of both the results and the results chart. The results chart compares trading the SPA3 signals (charted in red) to a buy and hold on the xao (in green). As you can see SPA3 investor pretty well tracked the xao from 2012 to 2015 and then has underperformed for the last 6 years from 2016 to 2022.

Regards
Ivor

This is quite alarming to say the least.

Gary are you able to address this issue please tomorrow at the webinar - That is, has SPA3 Investor under performed 2015?

As a matter of interest my XAO Investor portfolio started 30/06/2016 is currently showing 18.39% annuanalised profit against the XAO of 9.93, so it’s likely there is another explanation for Ivor’s results

As a matter of interest my XAO Investor portfolio started 30/06/2016 is currently showing 18.39% annuanalised profit against the XAO of 9.93, so it’s likely there is another explanation for Ivor’s results

I am not testing the whole SPA3 investor system per se. All I did was test the use of the SPA3 investor on the XAO index to use as a broad market filter. ie using the spa3 investor on the XAO (from my testing) does not seem to be a good idea to decide as to whether to be in or out of the market.

So is this enquiry relevant to Investor?From the outset the trader high market risk/low market risk concepts were not part of the Investor system so given the apparent success of the system why would you introduce them?