Fantastic Gary - sounds like it will be a very interesting presentation.
Look forward to seeing the results of the research
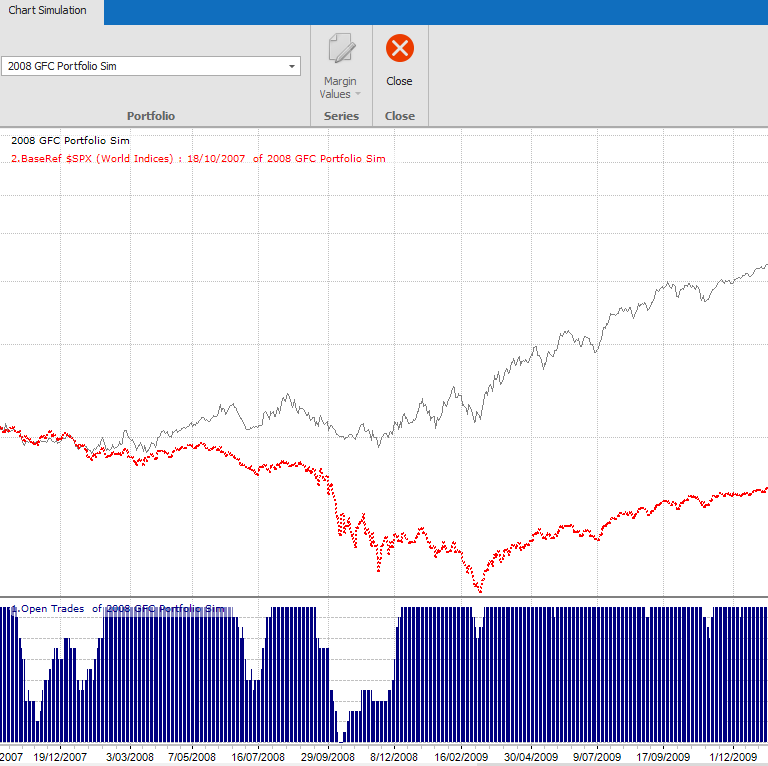
I had a look at the S&P500 over the 2007-2009 period and from my interpretation it is similar to the long, slow, deep correction that has occurred currently. From the top of 1576.09 on 11/10/07 the market fell approx 24% to 1200.44 on 15/07/2008 (after which it rallied 9% before dropping significantly). The current peak of 4818.62 was on 04/01/2022 and it fell to 3636.87 on 17/06/2022 a fall of 24.50%.
Paul,
I see that period a bit differently.
Two down legs. One of -18% over 5.25 months from the Oct 2007 peak to the March 2008 trough. And another of -52% over 9.75 months from May 2008 to Mar 2009.
The second leg down in 2008 is far easier to ‘trade’ that the first leg. As was the COVID Crash in 2020. Because the downwards price action is sharp and decisive causing Exit signals and few Entry signals.
I ran a Portfolio Simulation to get the ‘system’s view’ of how that period played out. Which all SPA3 Investor users can do with the The Simulator in Beyond Charts.
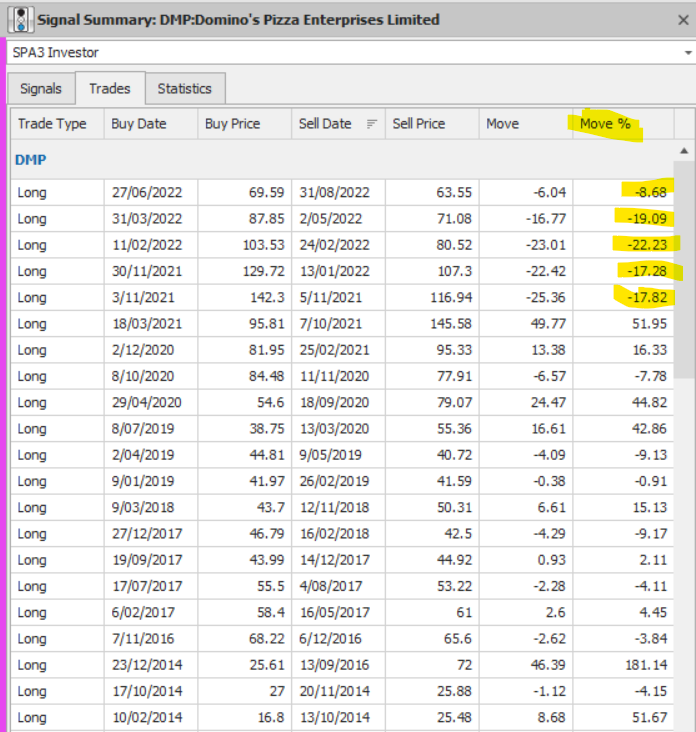
And just to put this into some context, the previous returns for DMP have been pretty good with reasonable loss percentages vs win percentages and win rates.
It’s just the recent downtrend (for nearly 12 months now) that has been horrendous with mostly outsized (over 15%) losses. Historically, 6 losses in a row hasn’t occurred before (the previous being 4 in a row but the loss percentages were way less). So an abundance of bad luck I would suggest. The only thing I could add is whether one of the researched filters would avoid all or part of this run of losses - which can have unintended consequences itself as Gary has mentioned! ![]()
Nick,
To curb yours and my curiosity I have conducted a decent amount of research using various MA’s as a filter for SPA3 Investor entries on US & ASX stocks. The sample dataset obviously now includes the challenging period on the ASX and US markets over the last year or so.
First up I should say that for stock timing the Exponential MA (EMA) provides much better results than other MAs.
I conducted ‘discovery backtesting’ (i.e. smaller samples of stocks over shorter periods) using a number of different lookback periods and then honed in on 6 different EMA periods (30, 55, 89, 105, 150, 200 days) on the larger universe of stocks over 22 years.
The backtesting process involves 2 steps: ‘raw edge’ research (same position size with unlimited capital to capture all possible trades) and then Exploratory Portfolio Simulation if required, where limited capital is used to trade a subset of all possible trades and where position sizes are increased as portfolio value increases.
‘Raw edge’ research determines whether there is edge degradation or improvement with using a trade entry filter over a large sample of trades over many different stock characteristics over different market conditions. Expectancy is the main metric used to determine which ‘raw edge’ is better, with other metrics taken into consideration. ‘Raw edge’ research with the same position size does not measure important portfolio variables such as Drawdown and Annualised Return.
If a ‘raw edge’ is similar or better with any trading system modifications, the next step is to use Exploratory Portfolio Simulation on historical data, where a subset of historical trades from a full potential ‘trades database’ emulates historical portfolios using different start dates, market conditions, # of positions and position sizes. This step provides important metrics on Drawdown, Annualised Return, and other now relevant ratios such as the Sharpe Ratio.
I also backtested DMP and FDX (a US stock that has similar periods to DMP over the last year) individually with the 6 different EMAs over 22 years to see if any EMAs made a difference with the added prices dataset since we last conducted similar research. Some EMAs definitely did. As you’d expect with the type of price action that you showed in your Post.
In summary, there was only one EMA filter whose ‘raw edge’ was close enough (was still slightly worse) to the current SPA3 Investor ‘raw edge’ to take the next step of Exploratory Portfolio Simulation - the daily EMA 105 (~ 21 week). Some Exploratory Portfolio Simulations resulted in better annualised growth and a lower Max DD.
At this stage I’m happy to divulge that it would be remiss of SWS not to conduct further research into potentially using the daily EMA 105 as a filter for SPA3 Investor entry signals.
The biggest problem that MA’s suffer is that during sideways markets prices continuously flip flop above and below the MA, causing flip flopping in and out of trades.
The other big problem, is that many winning trades (some really large winning trades), are filtered out by all filters. These large winning trades will NOT be signaled because the EMA filter condition was not met near the beginning of the big moving trend, e.g. missing trades that would have been signaled soon after a V-bottom.
Given trend-following produces a skewed distribution of trades with a long right tail (because we cut loss trades and let profit trades run), filtering out too many large profit trades can have a big detrimental effect.
The devil is always in the detail, so a deeper dive is required into getting a far better understanding of these two potential problems and how to overcome them, if an EMA 105 filter is ever to be used formally as part of the system.
As you specifically asked about using such a filter, and sufficient research has been conducted to decide NOT to rule it out, I thought I’d provide some feedback on what we’ve discovered so far.
To conclude, we are also researching some trading system ‘raw edge’ filters (i.e. not a Market Risk - we see a MR filter as fitting in the realm of Risk Management research).
If you wish to get a deeper understanding of the trading system design and research process, please read Part 3 of my recent short-book “15% Per Year in 15 Minutes Per Week”, which is available as a downloadable PDF in the Education Centre as part of the SPA3 Investor course.
Hi Gary
Just wondering if any modifications to the BAP rule when the market is in a confirmed downtrend would be useful. It’s clear that in this particular market taking BAP’s has been a losing strategy but of course in the long term that probably won’t be the case. I did wonder if there is any way to filter out this kind of slow death market fall though as I’m sure everyone is finding it very difficult to stay consistent.
Cheers Tim
Tim,
One thing that has confounded our research over the last few weeks on solving this USA Drawdown problem is that we have not yet been able to find a trades filter or Risk Management set of rules that improves returns on the US market when removing BAPs according to the researched rules.
We are obviously looking at a longer period than just the last 9 - 12 months to ensure that The Law of Unintended Consequences doesn’t negatively effect the system coming our of drawdown during positive market periods.
I acknowledge the difficulty in staying consistent during such trying market conditions.
Just about all my time is going into solving this problem without negatively affecting the overall system.
Hi all
Glad to hear the research sounds fruitful and drawdowns will hopefully be reduced (they can never be eliminated) and sounds like not a big drag on the CAGR which would be exceptional. Well done to Gary and team for responding to members’ concerns and undertaking additional research to explore if any solutions were ‘out there’. As an aside, I was unfortunately in FMG with a rather large loss (will be over 20%) - does anyone else think losses of this magnitude are a little too high? I get they are in the backtested edge but if you run an 8 or 9 stock portfolio you are smoking 2% - 3% of capital in this outcome alone. I know it’s only a single data point but along with the recent DMP losses I just wanted to raise it - all with positive intent of course. Just curious on others’ thoughts / experiences anyhow. In any event, I will just keep pulling the trigger.
Cheers Nick
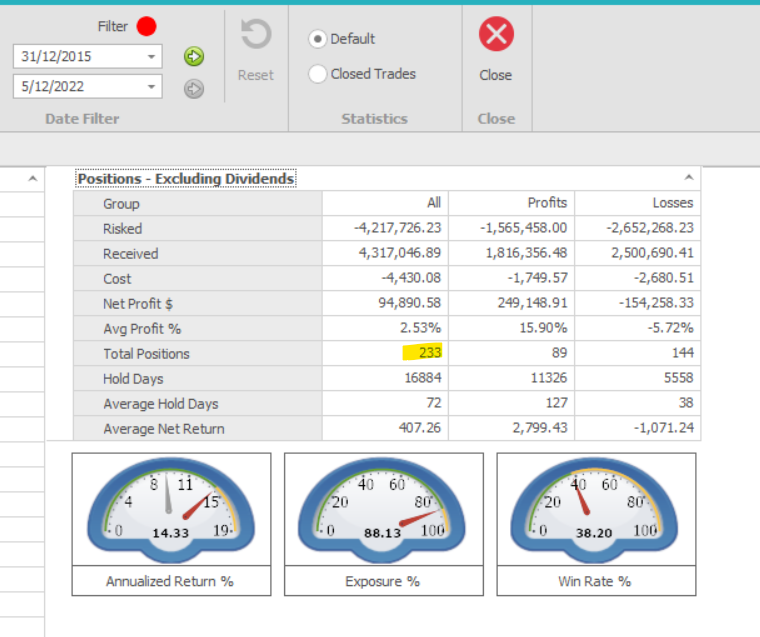
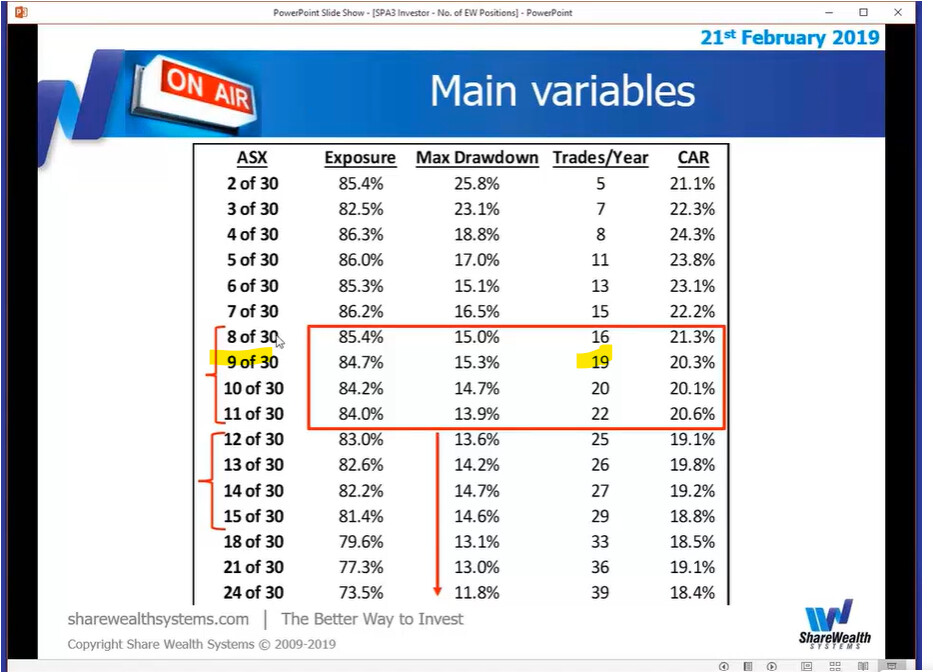
Just a further question to the stats - has there been an average of 33 trades per year vs the estimate of 19 trades per year? In my portfolio I have had 106 positions over 3 years and around 2 months so that seems to check out given the timeframe. I run 8 positions.
Hi Nick,
The trades per year in the slide you refer to was based on ATR_BO trades solely at the time. This typically produced around 2-3 trades per year per entity in your portfolio.
The larger number of trades in the public portfolio is due to the addition of BAP signals in the Investment plan. This results in a higher exposure of capital to the market and more trades.
Recent research shows that BAP entries have a positive impact on the SPA3 Investor Edge over the longer term in both the Australian and US markets.
Hope this helps.
Regards,
David.
Yep cheers Dave the BAPs explain it.