Has the definition of when a stock has a Valid status changed or is there an error in the report on the app? AMZN is currently shown as having a Valid status on the app yet its latest daily Low price is lower than the last three day Low price which I believe should give it a Non Valid status. I tried to find the current definition of Validity on the website but was unable to do so. Although I don’t run a relative strength portfolio, I do use Validity in my trading plan as a requirement for BAP entries – it would be good to be able to rely on the app for times when I’m away from home and access to BC is not so easy.
Thank you for pointing this out. Your interpretation is correct and there is an error in the app for Valid / Invalid states for BAP eligable stocks.
I will strive to ensure this is fixed as soon as possible as a hotfix to the App and Beyond Charts. Let me reply when the fix is available and I will provide further information at that time on when it will be reflected in the App.
You are also correct that it does not affect any of our SPA3 methodologies however, everyone’s preference would be for the correct information to be presented.
Thanks Campbell.
Could you please point me to where there is a definition/explanation of the valid/invalid signal. I think I would find this useful in the manner Don has explained above, but I need to understand it first.
Thanks Campbell. I’d also like to have the definition of Validity available on the forum, if it’s not already there. It may not have been retained on the forum following the relative strength public portfolios being discontinued.
Don
Valid / Invalid is not a signal that you can buy or sell off. It is a piece of information that is used within the Relative Strength Strategy for SPA3 Investor to aid decisions.
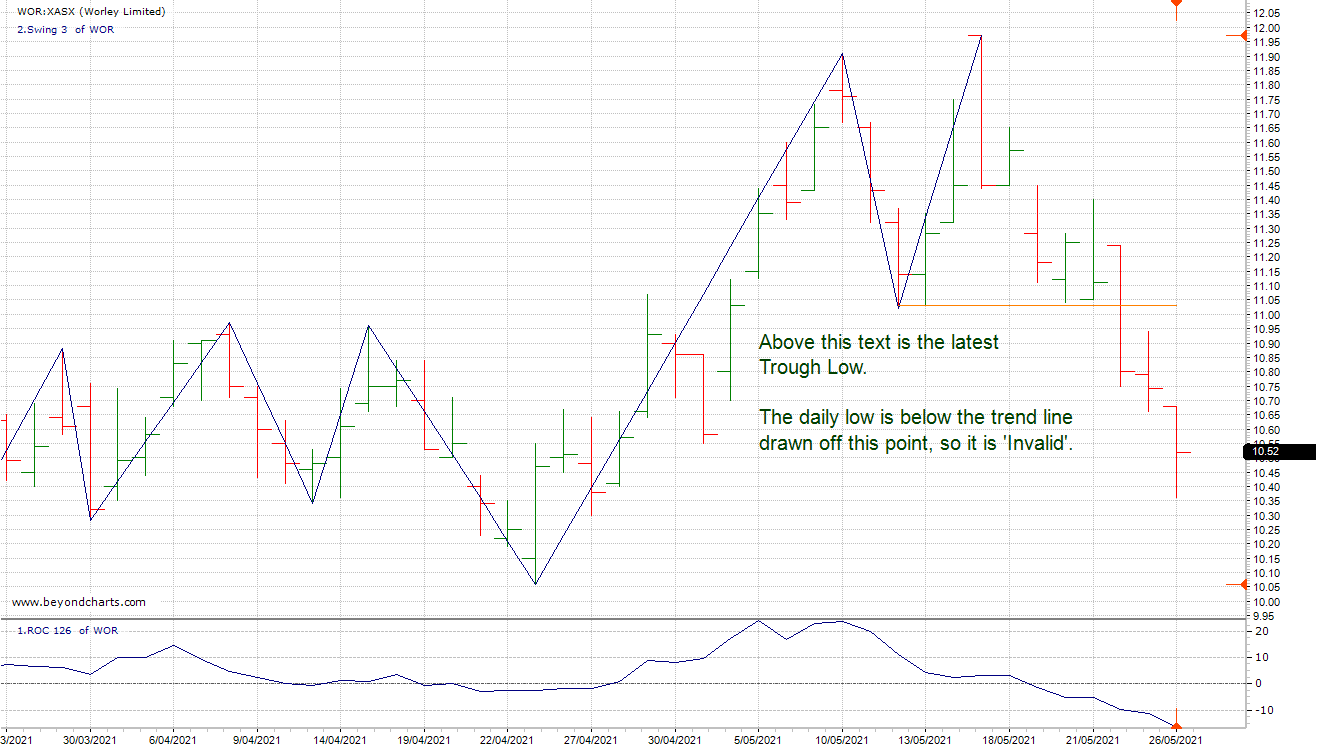
Valid means that the latest end of day low price for a stock is above the most recent trough low for a 3 period Swing Chart on a daily chart, the Swing Chart indicator can be found in Beyond Charts.
Invalid means the latest end of day low is below the most recent trough low.
The information summarises this technical check. Below is a hopefully helpful graphic for how to determine this status off a chart:
In context of Relative Strength Strategy, it is used as a filter for stocks to enter in to, in context that the strategy wanted to find a very small number of high performing stocks that were probable to continue their trend.
The strategy itself does work over a large sample size however, the psychological aspect of pivoting to new stocks each week in large position sizes (2-4 postions max for a portfolio) we found for most, difficult to handle in day to day execution. We still have functionality to enable the strategy however, we find most are much better off sticking to Equal Weighted for SPA3 Investor.
Hi Campbell, I have run a RS stocks portfolio for nearly 5 years based on the Reference Mannual which covered the RS strategy; however I have been looking for this on the web page and in Beyond Charts and can’t find any reference to the strategy or any information on it. Can you direct me where to look please?
Please see the link below for our archived manual with more info pertaining to the Relative Strength (RS) Strategy.
The validity status in the app is a legacy item that is in place for older customers who still choose to follow this approach.
For newer customers, we ONLY support the Equal Weighted approach and you should ignore these documents / validity signals. The RS Strategy is a high volatility strategy with the largest drawdowns and is very challenging to execute, and is best suited to those with a good deal of trading experience coupled with a very strong trading mindset.
thanks Campbell, to clarify, when you say the valid/invalid status is shown in the App, is it shown in the ranking of the stock. I can’t see the swing low status in the App but if the stock is below the 3 day swing low indicator, does that mean it is no longer shown ranked in the App?
Also I understand with the RS strategy, the swing low status of a stock is only relevant to determaning if a position can be entered, it is not a sell signal for an existing posituion.
can you confirm this please?
The Valid / Not Valid status is shown on the Ranking page within the app. Each open position carries this status on this page in the app. Closed trades do not show the valid / invalid status. It has nothing to do with the ranking figure itself, although both the ranking figure and validity status would be used when executing the RS Strategy. Additionally, you cannot see the actual Swing Chart indicator in the app, only Beyond Charts.
Valid / Not Valid is an interpretation of the indicator for the purpose of the RS strategy.
For RS Strategy, pages 18 to 21 of the manual Vincent posted earlier today outline the process for RS strategy if you need a reference point on reviewing execution process. It can involve swapping from one open SPA3 Investor position to another, which does involve selling a position and buying another.
There is a layer of differentiation between when you exit a position in RS strategy and the end of a SPA3 Investor trade (the sell signal). In the RS strategy you don’t necessarily wait for a sell signal to close out of trades in your portfolio, and rather re-align your portfolio weekly based on the RS swap criteria. This is an increase of complexity vs equal weighted which simply buys on the entry signals and sells on the exit signals.
Thanks Campbell, I had trouble finding the ranking page in the App, but got it now.
Your points understood
BTW I note that my RS stocks portfolio started in 2016 is presently showing 35.17% annual profit and ROC of 331.48%!
however, as you point out the system is volatile but I find it a good second string to my EW portfolios
Yes Don it probably is. 2018/19 was minus 41% CAGR but since then it’s 507% to date,
win rate about 54% but hasn’t been below 45%
The volatility hasn’t really bothered me and while we don’t know what’s in for us next, in a bull market I can see further good gaiins (fingers xrossed!)
But definitel;y my smallest portfolio!
Hi Wakefield,
I am interested in how you have positioned your leveraged RS portfolio. What percentage is it of the total funds in your share portfolios?
Don