As you’ve no doubt experienced and heard me say a number of times in webinars for some time now, active investing on the ASX, whether with SPA3 Investor or otherwise, was tough from August 2021 to August 2024.
Dave and I covered this in some detail in the last MMM - Portfolio Considerations Webinar on 15th Jan, when we discussed The Discomfort Zones of trading.
However, over the last 6 months since August 2024, trading moved from a Discomfort Zone to a Comfort Zone again. Moving between these 2 zones is an ongoing part of the engaged investors journey, whether active or passive. Ultimately an investor’s outcomes will be far more dependent on how they mentally handle and what actions they take during Discomfort Zones than during Comfort Zones (obviously have to be in the game to get the benefit of the comfort zone periods).
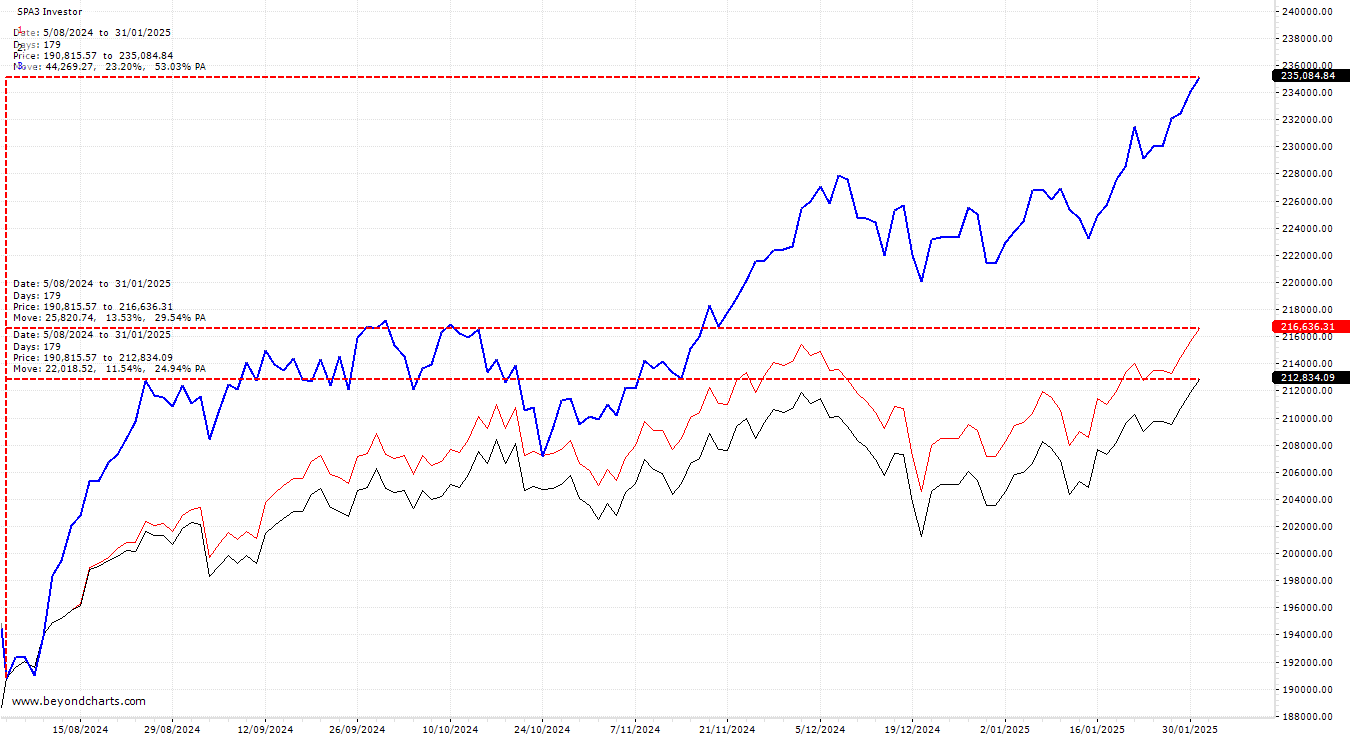
The following chart shows the ASX Public Portfolio (blue line) over the last 6 months from 5th August to 31 January - 23.2%. A clear outperformance so far by 72% compared to the $XJOA of 13.5% (red line) and double the $XJO of 11.5% excl. divs (black line).
When it comes to performance, traders focus way too much on short term underperformance. Stopping most active investors achieve long term outperformance. Kahneman & Tversky tell us that humans get twice the amount of displeasure and discomfort from losing than we do pleasure and comfort from winning.
Of course, our latest training courses (The PROCESS + MINDSET Training Intensive and the Learn To Trade Properly Study Groups) have one of their trading tenets to move towards a neutral mindset.
The purpose of this post is twofold, to:
bring a little focus on trading comfort zones, and
ask others, who are comfortable to do so, to post about their pleasurable zones and periods. How has your portfolio performed over the last 6 months?
PS:
If you missed it or would like to watch the 15th Jan Webinar that Dave & I did, you can watch it here:
Following up on Gary’s comment regarding how my portfolio performed over the last 6 months I post it up here.
It has not performed as well as the Public portfolio, due possibly to a different stock combination, however it has outperformed the index and is performing a lot better than previous years since I took my opinion out of the equation! This has brought me a lot of personal fulfillment.
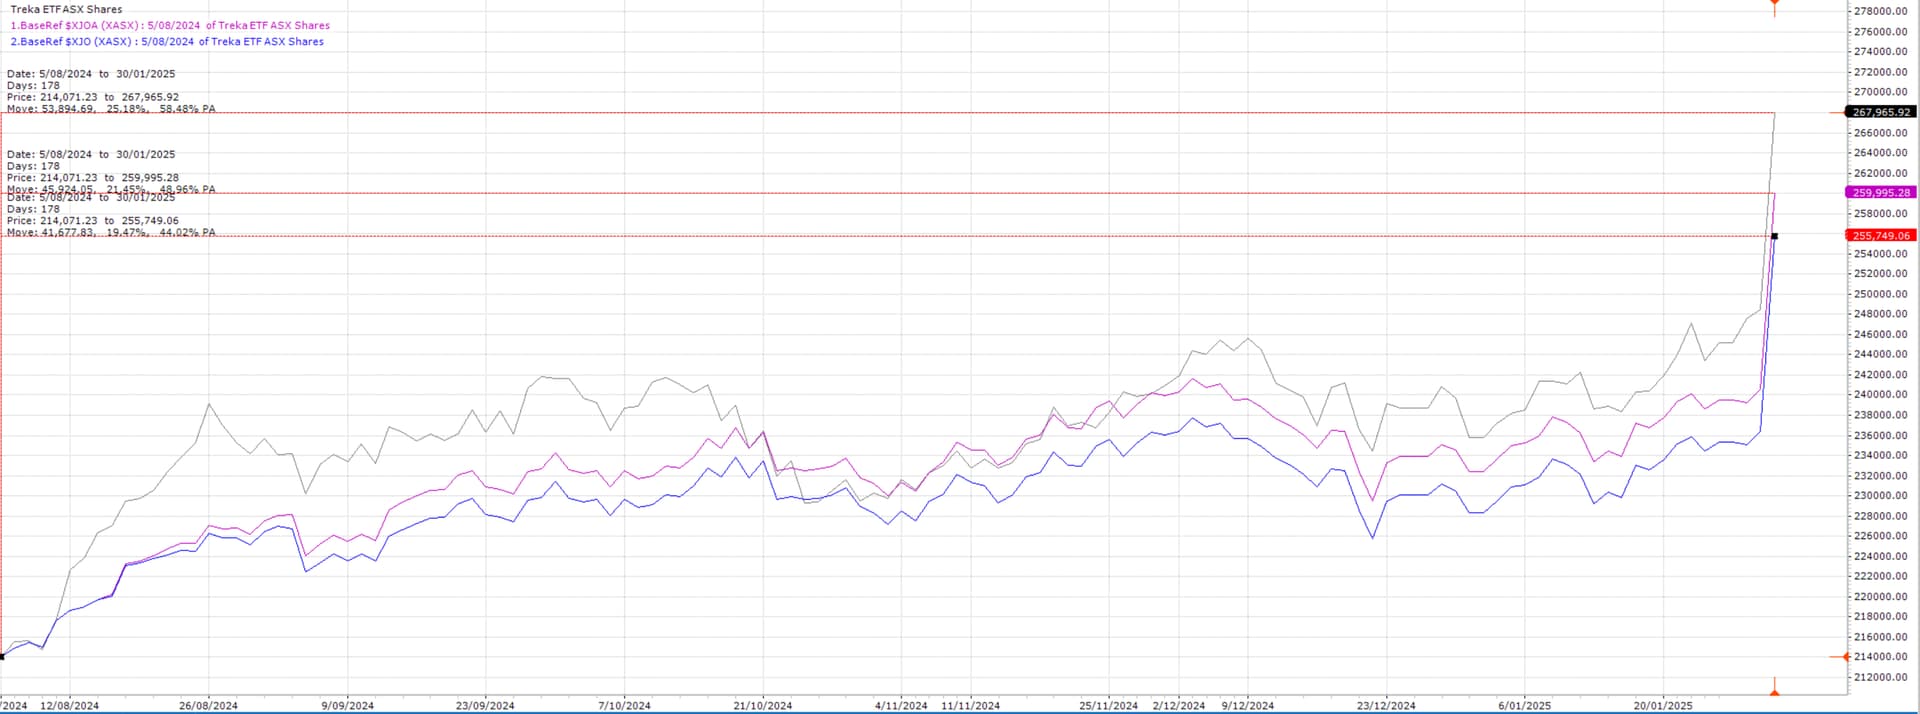
The spike at the end is due to a capital injection.
My US portfolio has given me a lot more pleasure than my AU portfolio, as it has performed very well.
Since completing the LTTP training I now trade more peacefully and my objective is to make trading an even more peaceful but an enjoyable experience but in reality to be quite a boring, if that makes sense.
Firstly apologies for the delayed response. My PF’s have also not performed as well as the ASX stocks PP over the same dates - 5/8/24 to 31/1/25. As such I feel just slightly less discomfort during this period than prior; no ‘comfort’ as yet for me. I must declare that during October 24 I went to 100% cash (per my investment plan) for medical reasons - planned hospital surgery, unable to action trades for 2 weeks - which meant I probably closed some good trades early. Maybe the comfort period will come when we have a decent market pullback and SPA3 Investor takes us to mostly cash with significant catch up gains against the index?
My results for the period referenced above - 5/8/24 - 31/1/25 are -
ASX Stocks: 9.7% and ETF’s 6.7% v XJOA 13.5% i.e.4% and 7% lower, respectively.
Since my PF’s inception to 31/1/25 -
ASX Stocks (Inception 30/6/23): 0.3% v 15.3% i.e. 15% lower;
ASX ETF’s (Inception 30/6/24) 4.1% v XJOA 12.1% i.e.8% lower.
As an update to now (27/3/25) my underperformance has reduced with the recent market pullback -
ASX Stocks (Inception 30/6/23): -0.2% v 10.2% i.e. 10.4% lower;
ASX ETF’s (Inception 30/6/24) -0.2% v XJOA 5.8% i.e.6% lower.
Interesting, my ASX portfolio did 31.66% profit between 5 August 2024 and 31 Jan 2025;
11.26% from inception (30/06/2016)
My US portfolio is substantially better at this point but there have been periods when ASX outperformed the US.
( note both portfolios are structured as 50% equity and 50% CFDs which does make them a bit bumpy at times - especially the US))
36.5% better than the ASX Public Portfolio and 134% better than the $XAO, from 5 Aug 2024 to 31 Jan 2025.
And 1.18% Annualized Return better than the $XJOA since 30/6/2016.
That seemingly tiny margin of 1.18% better than the $XJOA results in more absolute return as follows:
Years
Absolute % Better
10
11.2%
15
17.3%
20
23.8%
Of course, the alternative for around 80% of long-term investors (example is Super) is Balanced Fund / Target Date Fund type returns, which over the long term average between 1.5% and 2.5% annualised worse than the $XJOA ASX200 Accumulation index. Mainly due to fees and diworsification.
So the more realistic alternative for comparison purposes for long-term investment capital for the those who do not pursue learning to trade and invest properly is 2.68% - 3.68% worse annualised returns compared to Wakefield.
Taking the midpoint at 3.18% (1.18 + 2) better than these funds:
Years
Absolute % Better
10
33.6%
15
54.5%
20
78.6%
So over, 15 years, say, starting with $200,000 and achieving 3.18% better returns would result in $349,462 more money.
This is the magic of compounded returns.
Warms the cockles of our hearts here at SWS to see your results.