Hi All - I have just watched yesterday’s “Weekly Wrap” where David answered a question about the Rankings data. The rule is to choose the highest positive, or smallest negative (ie price change over the past 89 trading days) if there are more Buy signals on a day that spaces available in a portfolio. I’m curious - not questioning the rule as I’m sure it has been backtested, but more generally about momenturm/trends in stock prices. The rule implies that it is better to get on board with a stock that has already had a higher price movement in % terms, rather than one that has had lower % increase, therefore might have more positive ahead of it. I know that SPA doesn’t pick the highs and lows of trends, but it is an interesting rule when the SPA indicators are momentum/price based, not fundamental analysis driven.
Generally it is thought that high ranking (RS) stocks are better than low or -ve RS stocks. There are systems based on RS and work at times and don’t at other times. You can back-test these stocks if you have the inclination to arrive at whether they have an edge or not and under which conditions.
One obvious issue may be that the stock with a high RS could have reached its peak and has a falling RS which won’t show its direction over a day or two when you have to buy the stock. Conversely, a down-trodden stock with a massive negative RS may be at the start of a huge run upwards. You cannot know easily which is which. Regardless of high or low, the current system and edge is based on taking the random highest RS available (for better or worse) however the method is mechanical and consistent. If the RS is a point of contention, then an easier way would be to get a dart board and blindfold and whichever number gets hit is the stock you take that has that number attached to it. I suspect the long term outcome will have a minimal effect on the researched edge.
Members can actually test the difference between taking candidates with the Highest Ranking versus the Lowest to see what difference it makes, by using the Simulator in Beyond Charts.
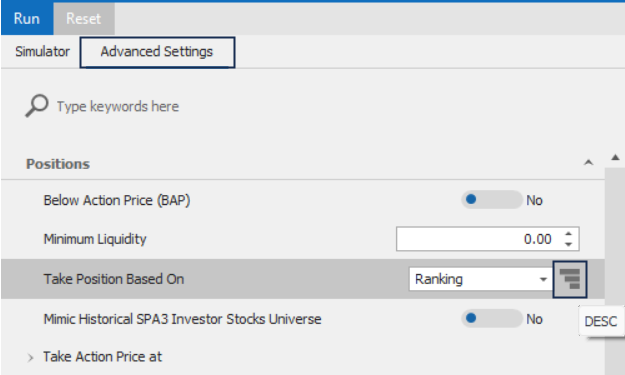
This is done by clicking on the 3 Bars to the right of the Ranking Selection, on the Advanced Settings tab in the simulation setup window.
Each time the 3 Bars are clicked, the Ranking will toggle from “Descending” (Highest Ranking to Lowest) to “Ascending” (Lowest to Highest).
For instructions on how to run simulations you can view this lesson in The Systemized Investing Program.
Sally, you can also use the Simulator to test other Ranking periods.
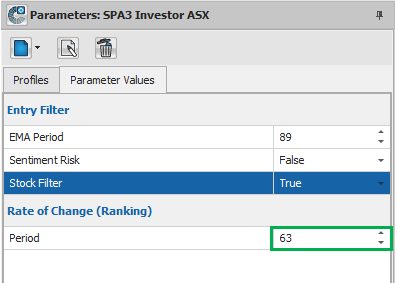
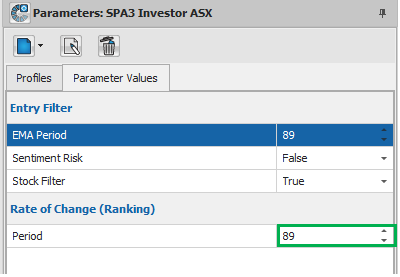
For example, SPA3 Investor uses a Rate of Change of 89 and this can be altered in the Parameters Window as shown below to say 63, as an example.
When you alter the Rate of Change (Ranking) Period this will flow through to the Scan engine, and will therefore be picked up by the Scan Source “SPA3 Investor ASX Stocks” in the Simulator.
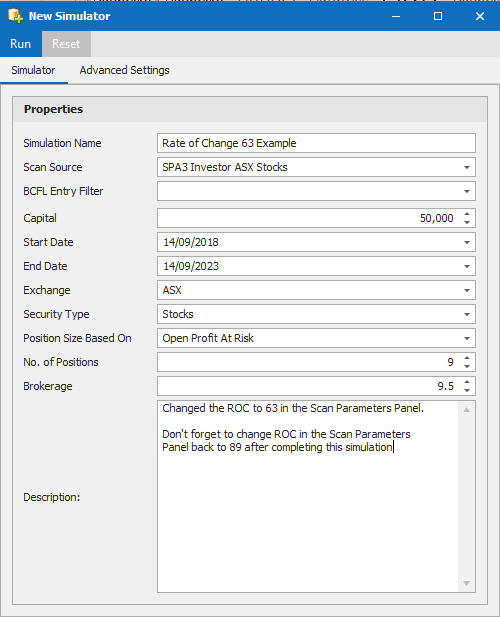
If you choose to do this, it’s good practice to name the simulation such that it mirrors the change as shown.