Hello Team, I’m quite surprised at the very low liquidity of some of the new stocks in the SPA3 Investor universe. One example arose for me today with the buy signal for ARB. I run 3 separate portfolios, & my position size in any one of those portfolios is greater than the total ARB traded on 90% of the days. That’s not saying I’m a big investor, but that ARB is just not a suitable stock in my mind, to make it into your universe. I’ve noticed other stocks with low liquidity in the past few weeks, but didn’t note them down for discussion. I’d be interested in your perspectives on how ARB & other low-liquidity stocks made it into your universe. Do you have a ranked liquidity table for the SPA3 universe - would be useful & interesting?
Many thanks, John
Hi John,
Section 4.2 of the SWS ASX Public Portfolio Investment plan touches on this issue. I’ve copied that section below.
2 Liquidity Risk
No position will be taken in any Stock whose daily liquidity averaged over the prior 3 months is less than 10 x the position size of the individual position. This is a simple precautionary rule that could be used to help minimise liquidity risk.
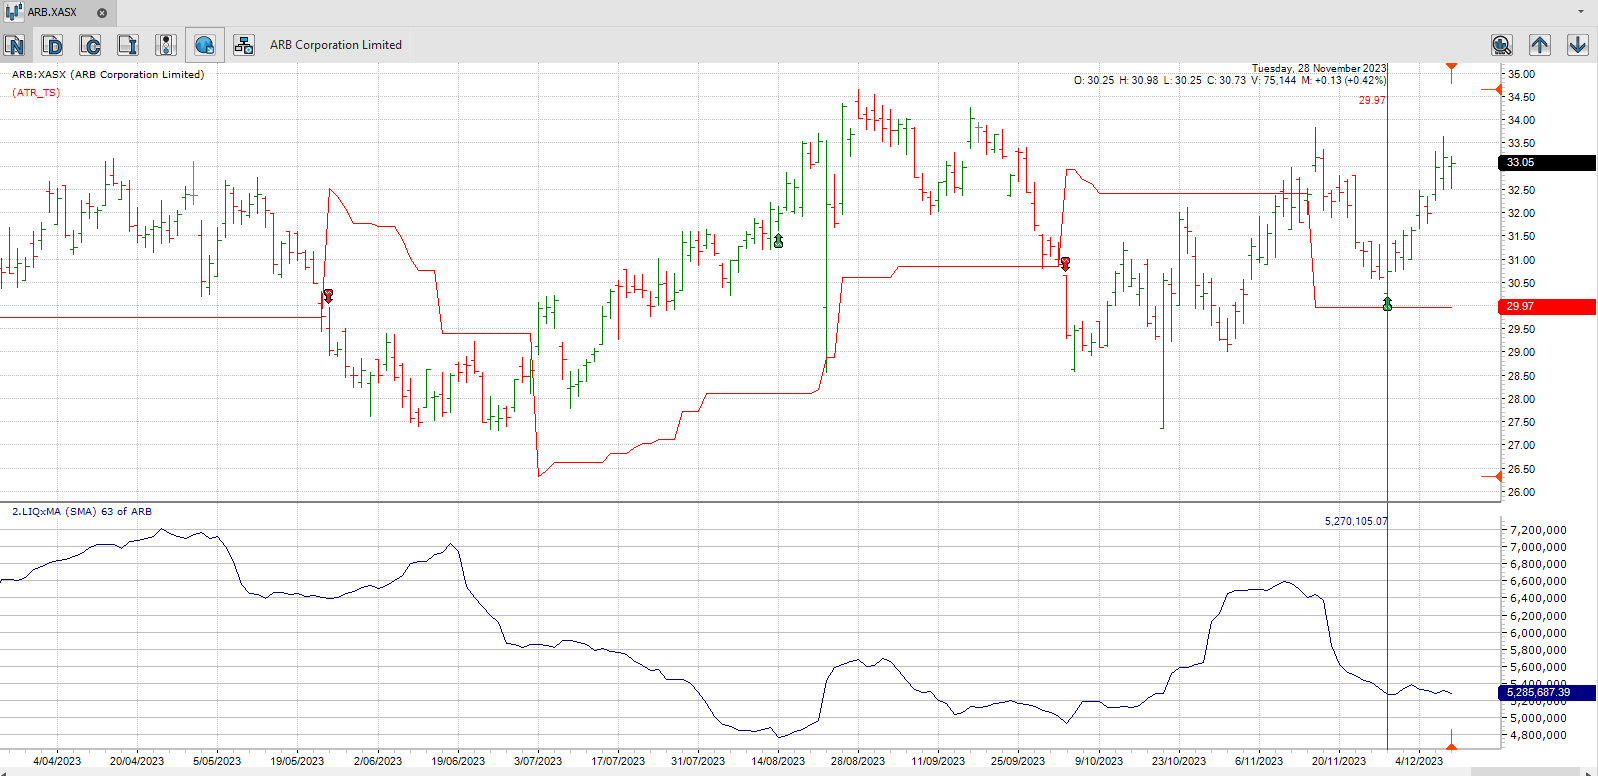
For example, below, the daily liquidity of ARB is in excess of $5,270,105.07 and as such is unlikely impact greatly on entry and exit prices achieved in any transactions on smaller portfolios.
The higher the liquidity the better and expanding the multiple to 20 x position size would help to reduce liquidity risk even further, particularly for larger portfolios.
Thanks David, useful info, & I agree with the guidelines.
I hadn’t contemplated that the universe of ASX stocks that meet your tradability & liquidity criteria would be as small as it is. Chatting to Gary was useful in this regard too. I don’t consider myself a “large” investor by any means, but my position size is such that ARB doesn’t meet the suggested threshold for liquidity. I imagine that SWS users would in aggregate easily demand much more than the total daily liquidity of ARB, if all were to strictly follow the BUY signal on the day, & thus have great difficulty offloading on the same day when a SELL signal is raised within SWS? This is why I’m surprised to see stocks with such low liquidity included in the SWS universe.
Regards John
John,
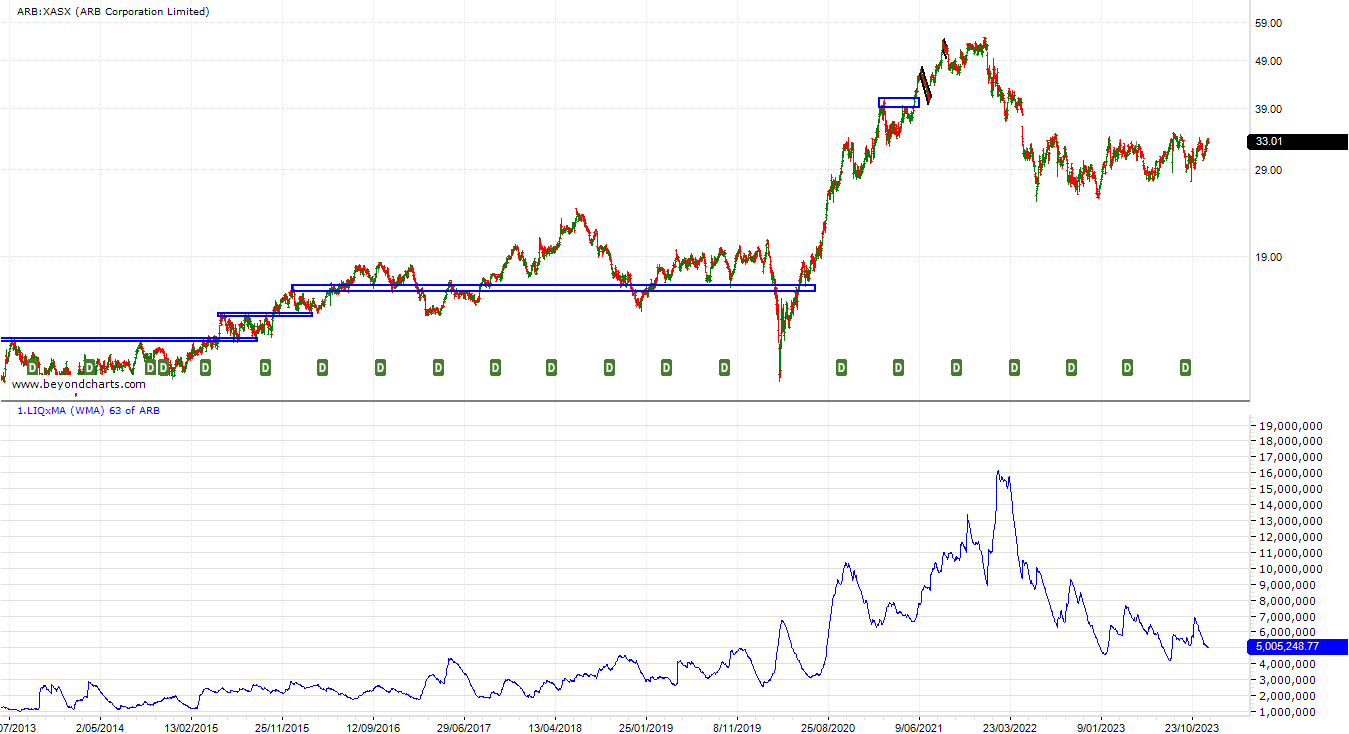
The chart shows ARB average liquidity over the last 10 years. The LIQ xMA indicator is available in Beyond Charts to calculate average liquidity, which is Price * Volume. I use a period or 63 days to do the averaging.
You can see that liquidity has fallen from a peak of averaging $15M a day early in 2022. It also shows that liquidity changes.
Averaging tries to normalise spikes in volume when large players accumulate or distribute their holdings.
Trust that this gives further insight.