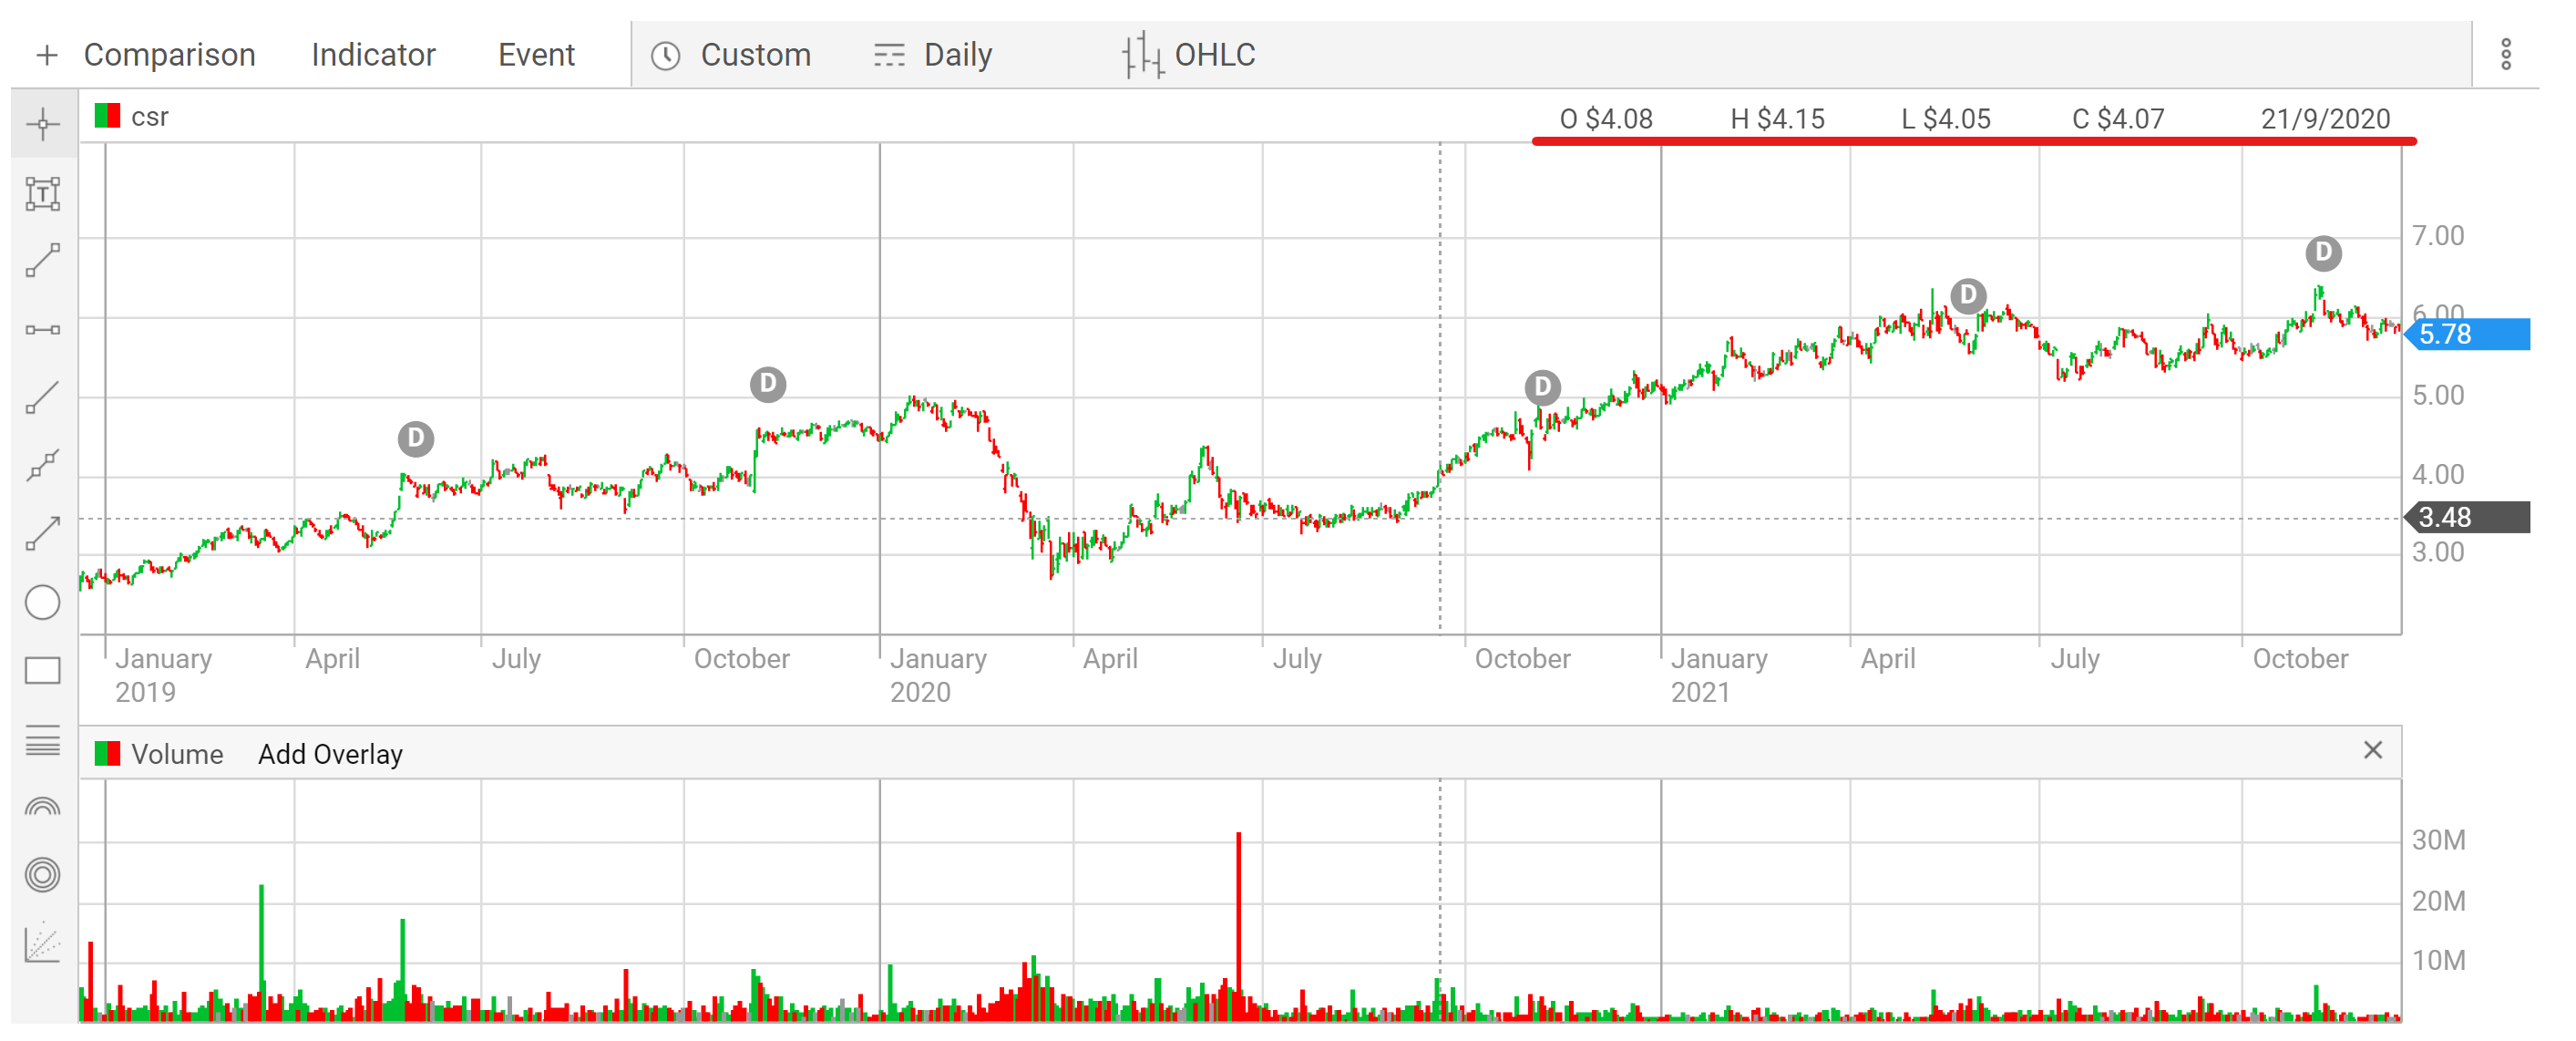
I was looking at back data for CSR at the time of purchase which was on the 21st Sept. 2020 - the day after the last signal price buy trigger.
My contract of sale shows the price paid as $4.20. In Beyond Charts the maximum price on that day is $4.15 I have checked other historical data from another site and the same $4.15 applies.
I check every purchase made and the contract price paid and I would have picked up that sort of discrepancy on the day if it was wrong.
So my question is: “How is this so?”
The only thing I can think of is that there has been some sort of adjustment made to the share price between then and now.
Does anyone have any other ideas?
Hi Phillip
Who is your broker?
Are you trading with CFD’s?
Hi Ross,
Broker is Self Wealth Trading.
Instrument is shares with CHESS holding.
Contract note has the price at $4.20 and same appears on the annual statement.
I cannot imagine they sold at a higher price than I ordered, as all my trades are Limit trades and I would have noticed.
Also the amount purchased was the correct position size which I would have calculated at the $4.20 price point.
The odd thing is the price that now shows on the historical data where it shows the highest price for the day at $4.15
Hi Philip, i’ve checked a few different data sources and the historical high on that day was $4.25 so i suspect the price is incorrect on BC.
Cheers Boyd
Hi All,
Beyond Charts uses adjusted price data. You can read more about adjusted price data here: Adjusted Closing Price Definition.
The price shown in BC is consistent with what is shown on the official ASX website. Refer to the screenshots below:
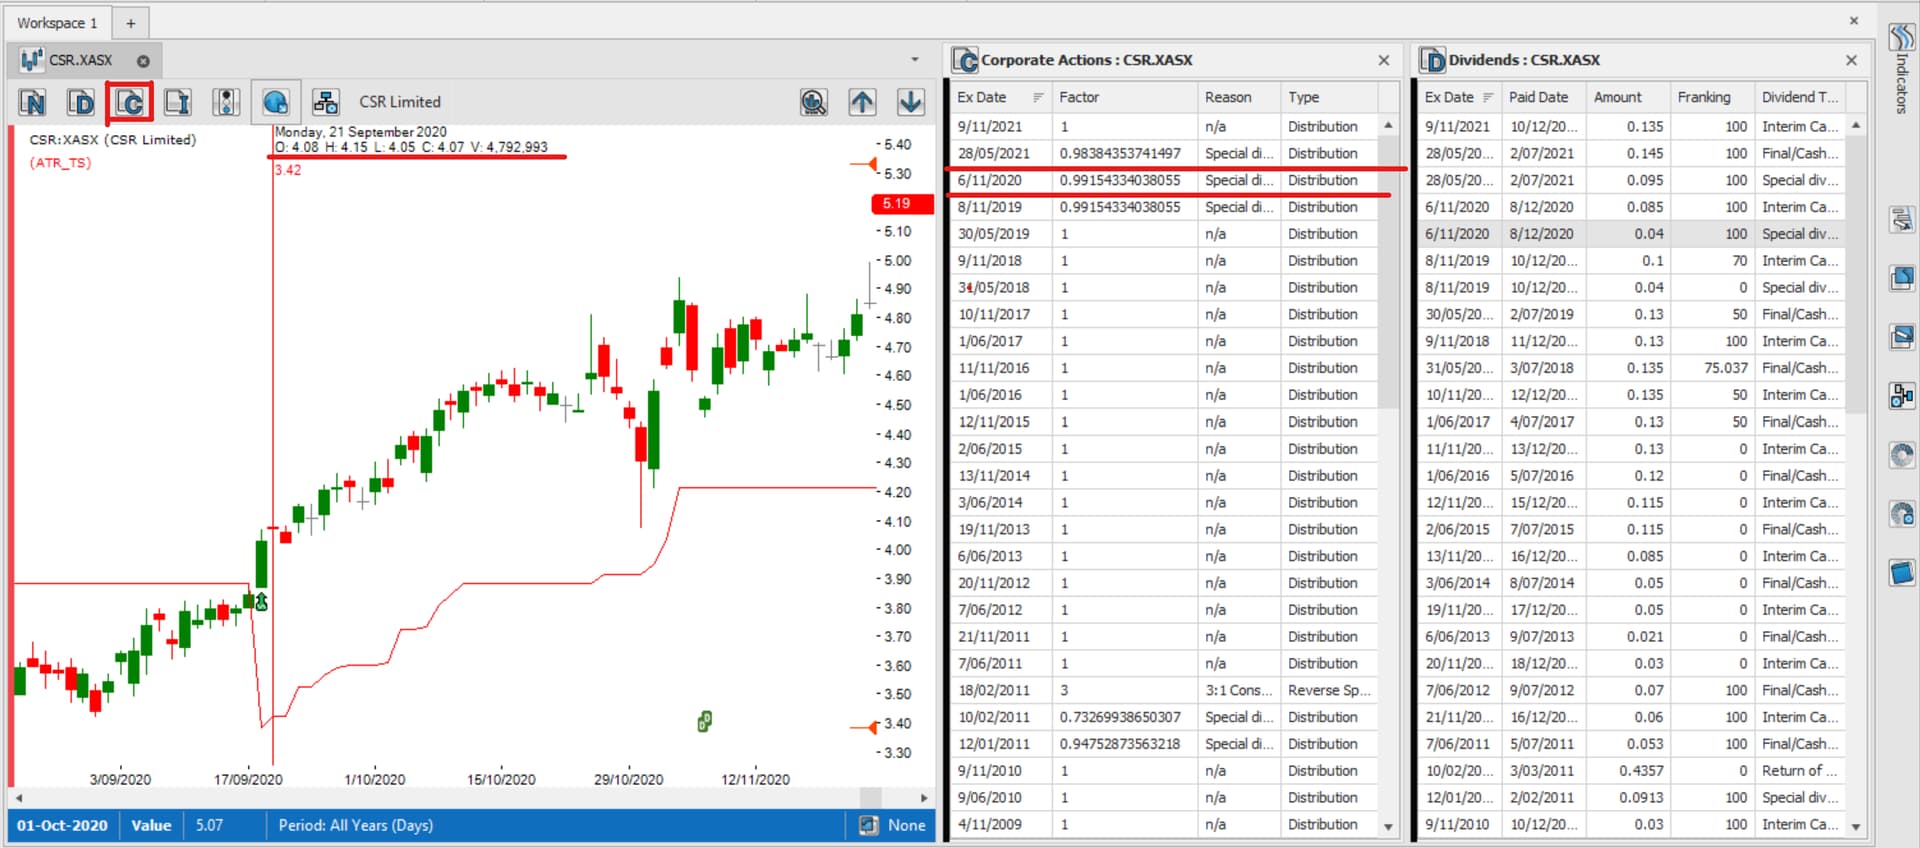
Phillip, the reason for the difference is that there appears to have been two price adjustments since your purchase date, due to two special dividend distributions. (Underlined in red in the screenshot above.) I haven’t gone digging for the specifics of these distributions but you can normally find the official announcements on the asx website: CSR share price and company information for ASX:CSR
To view these corporate actions in BC, click on the “C” icon just above the chart for CSR. (Refer to the red rectangle in the screenshot above.)
To reconcile, if you multiply your purchase price ($4.20) by both the factor adjustments, the resultant price should fall into the daily range shown in BC.
i.e. $4.20 x 0.98384353741497 x 0.99154334038055 = ~ $4.10
Hope that helps.
Regards,
Vince.
Thanks Boyd.
Hi Vince,
That would explain it.
As it so happened, I downloaded the public portfolio and checked CSR. The PP bought CSR a day after me at BAP for $4.14988. The BC high for that day was $4.08.