I have noticed that MS (US scan) shows as open however closed last night under the IST green trailing stop.
Hi Phillip,
Thanks for the question on the price action signal “IST”.
Please see the description and explanation below, with reference to the need for a down day (red bar) for a signal to be generated.
IST = Inside Swing Trough
This is the Formation of a higher trough after lower Peaks have formed.
A Higher trough confirmed after lower peaks.
IST_TS now Active at the lower of the 2 Troughs
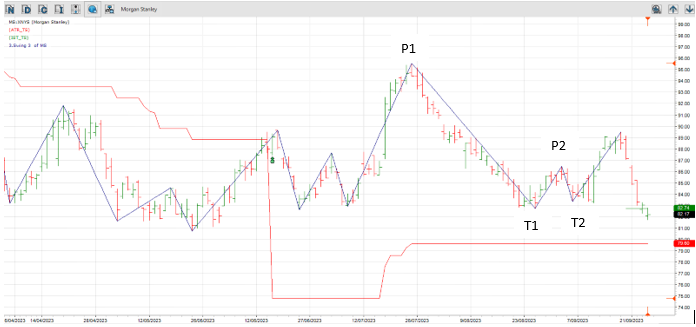
Note: For an exit signal to occur not only must the price close below the IST_TS, the closing price must
also be lower than the opening price on the day…… Eg, a down day as shown by a red bar.
Currently the last bar is green since the close was higher (marginally) than the open.
Hope this helps.
Thanks David. It makes sense now.