Instead of continually sending user requests into Support, I will start a list here as follows, and I encourage others to add theirs or make comments. Don’t get me wrong I like Beyond Charts and the built-in System scans, it’s more incredible than many other chart & scanning software I’ve used 
Requests for consideration:
a) Control Z to undo a deleted line or indicator on a chart. At times I get a bit clicky and accidentally delete an indicator, only if there were an undo, would save having to re-insert, organise & set up the colours etc.
In addition to setting up symbols, colours and line colours for custom written formulas; could this all be done in formula editor under Formula Properties sheet.
b) No overlapping indicator labels on right side chart index. With auto contrasting labels for when you have a lighter colour indicator and the label marker is also light coloured. Or have two indexes one left, one right to separate overlaid indicators.
c) Wider colour gamut pallet for all chart colour selections like backgrounds, grids, indicators.
d) Enlarge single indicator panel under price chart, or full size window; helpful for reading fine line conversions when there are more than 2 indicator panels.
e) Smaller Triangle symbol set.
f) Chart period buttons Day Week Month buttons on the chart window.
g) Equi-volume charts.
h) Be able to reference system indicators for use in Beyond Charts Formula Editor, for example; SIROC, ATR Trailing Stop, Base Reference.
Glitches:
a) I cannot, for some reason, use Auto Save for Analyses as it will recall very old chart setup overlays that have been deleted long ago. This means I have to save manually the chart analyses. I would like to see any analysis be designed in such a way that it reflects other modern chart packages to recall lines on all charts without any user input. Inline with this; a slim toolbar for lines and symbols etc. on the chart for quick use.
b) I’ve noticed when the Overlays slots F1 to F11 are full the overlays get overwritten by other slots and lost. So I always leave 1 empty slot which seems to stop this problem. Further to the Overlays; could there be more slots allocated? Maybe enough to cover the ASX300 index list of 14, so 15 or 20 slots?
c) Workspace organisation; would like to better organise Workspaces to order them on the toolbar line, so they keep their positions.
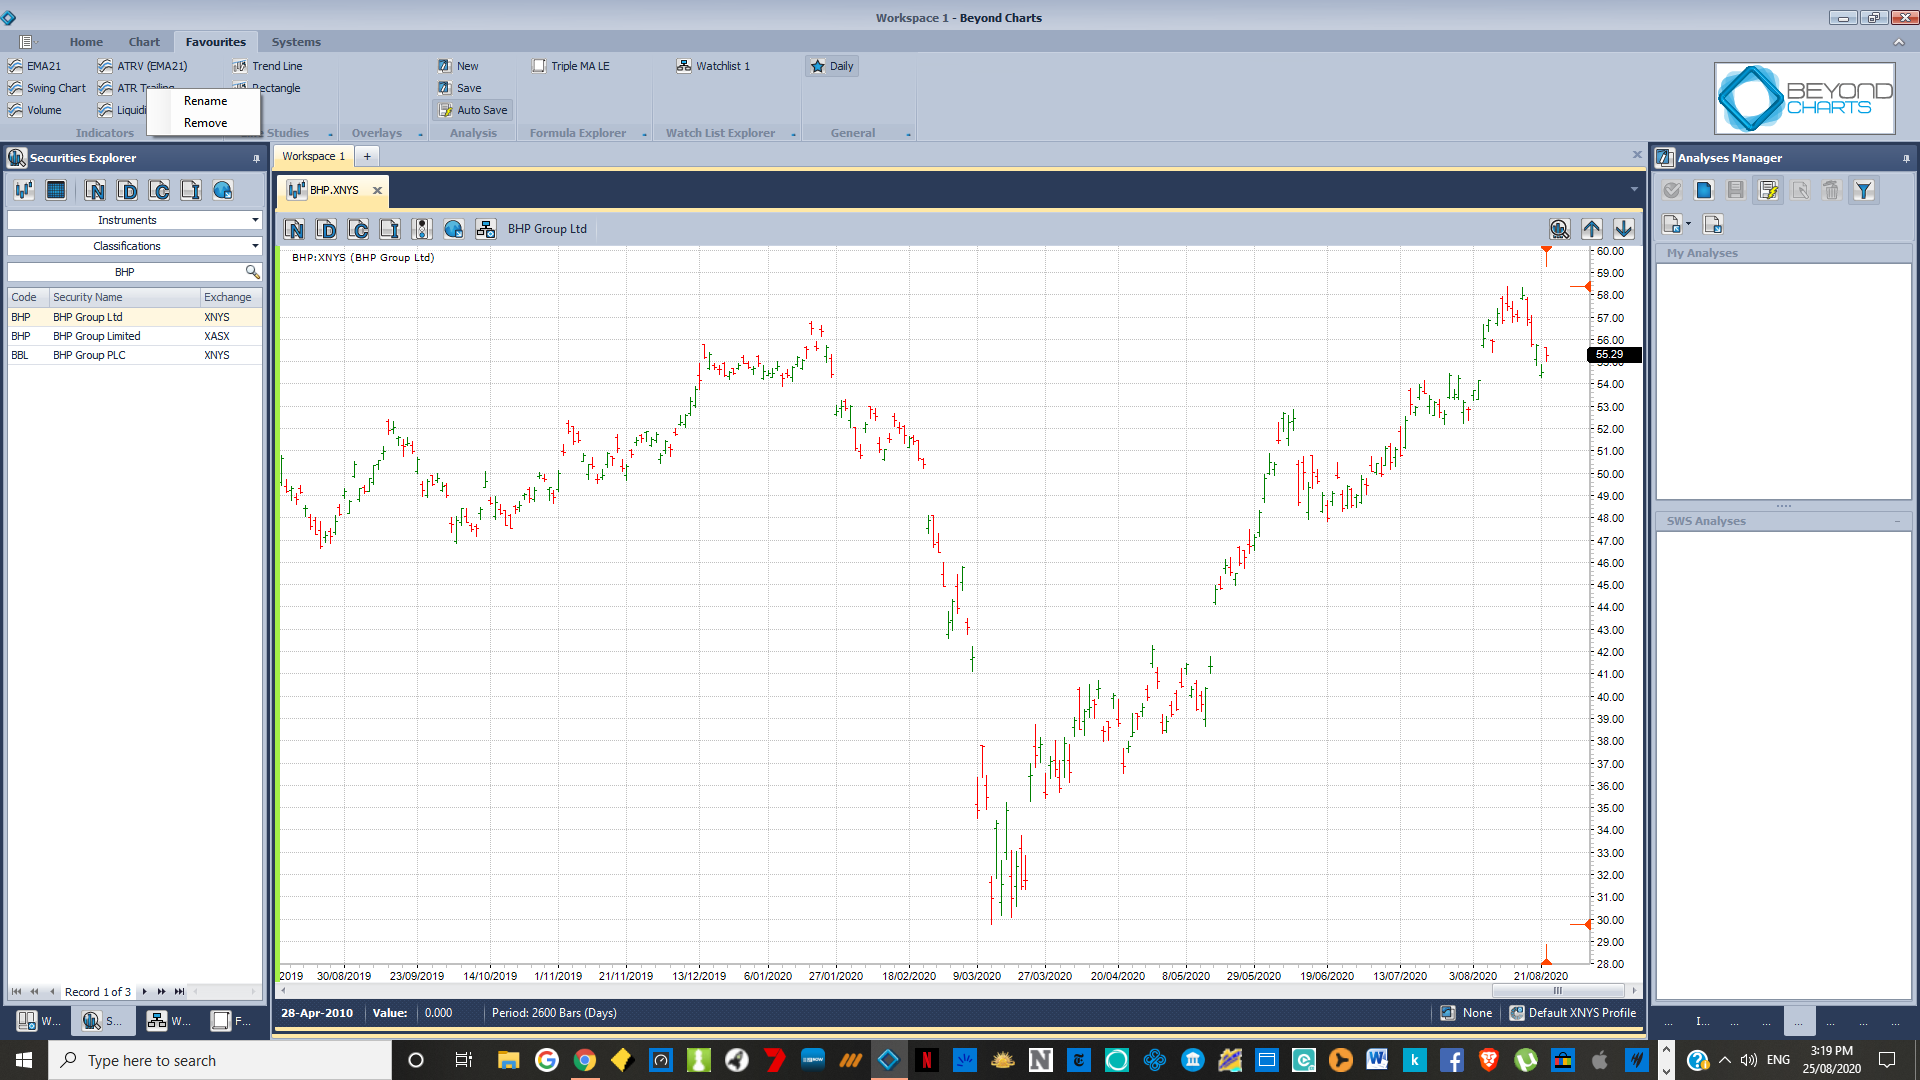
d) Favourites; although I don’t used favourites as yet, preferring to use Overlays panel, when I did set up some shortcuts I was unable to delete them, there is probably a way to delete but it defeats my efforts as a simple to do process, they remain there still having tried several times to remove them. Could there be a form sheet to list all listed favourites to easily organise or delete them?
e) Have a ‘check’ toggle box for Column Chooser so your selection can be recalled next time you open a Data sheet. I have to hide and select from the Columns and Chooser on a daily basis.
f) Link in the Market & Sector Risk status data into the Column Chooser selection panel to add the market and sector risk info into non system scans; so for example $XEJ (State=High, and otherwise Low) is represented in the data sheet for all stocks in that sector. Thus adding Sector Risk status to the Formula editor for use in showcol().
g) I get chart critical errors daily, I normally just ignore them as they are non-descript and don’t interrupt work flow, or otherwise close the chart and re-open a new one. But there are chart glitches that relate to saved formula re-names or FMLVAR name changes within the formula that cause a great deal of chaos in the chart, and are tricky to track down if you have more than a few formulas being referenced in charts. A List sheet for the references in the charts would help there that highlighted where the problem is.
In addition to above; use a numbered line list in the formula editor that would be used to source formula errors.