The Active Strategy #2 as described in this week’s Connect & Grow session appears to be very similar to the short term system that was developed when I did The Trading Game course with Louise Bedford & Chris Tate. The search parameters using preset volume, liquidity, 52-week highs, breakouts, risk management, trailing stops & price to search the entire market for suitable candidates. At the time I did the course I used Metastock coding & charting. The Active Strategy #2 has a few more tweaks & appears to be a more concentrated system without portfolio risk management.
At the time I was working full time and found the daily scans to consuming however I am now retired and in Stage 4 lockdown so I have all the time in the world to launch an Active Strategy #2 portfolio and to have a bit of fun in the process.
Gary,
I am not familiar with The Trading Game systems they teach.
However, the SPA3 Trader liquidity settings, risk management etc were well established basic parts of SPA3 long before The Trading Game business was started by Louise and Chris.
We were doing mechanical SPA3 Trader scans in the late 1990’s.
The Active Strategy #2 covered in the C&G Session is NOT a mechanical system. But it does use mechanical concepts.
I purposely put it forward as a subjective system to showcase other ways of trading, and to show how other functionality in Beyond Charts can be used.
I am a mechanical trader/investor 100% of my investible capital nearly all the time. However, from time to time, and time permitting, I will set up a Satellite with a maximum of 10% of my capital, to use mechanical buy signals as alerts and overlay subjective technical analysis criteria on top of that alerts process.
The time to do this is when pockets of the market really trend well in the short term. Like Gold & Silver and IT have been doing.
But this doesn’t remove the need ti be disciplined and ensure that exits are well-defined before entries are followed.
Regards
Gary
Didn’t mean or suggest they are the same, just similar, Both use some mechanical concepts, trailing stops and a degree of subjectivity. More than one way of skinning a cat I guess.
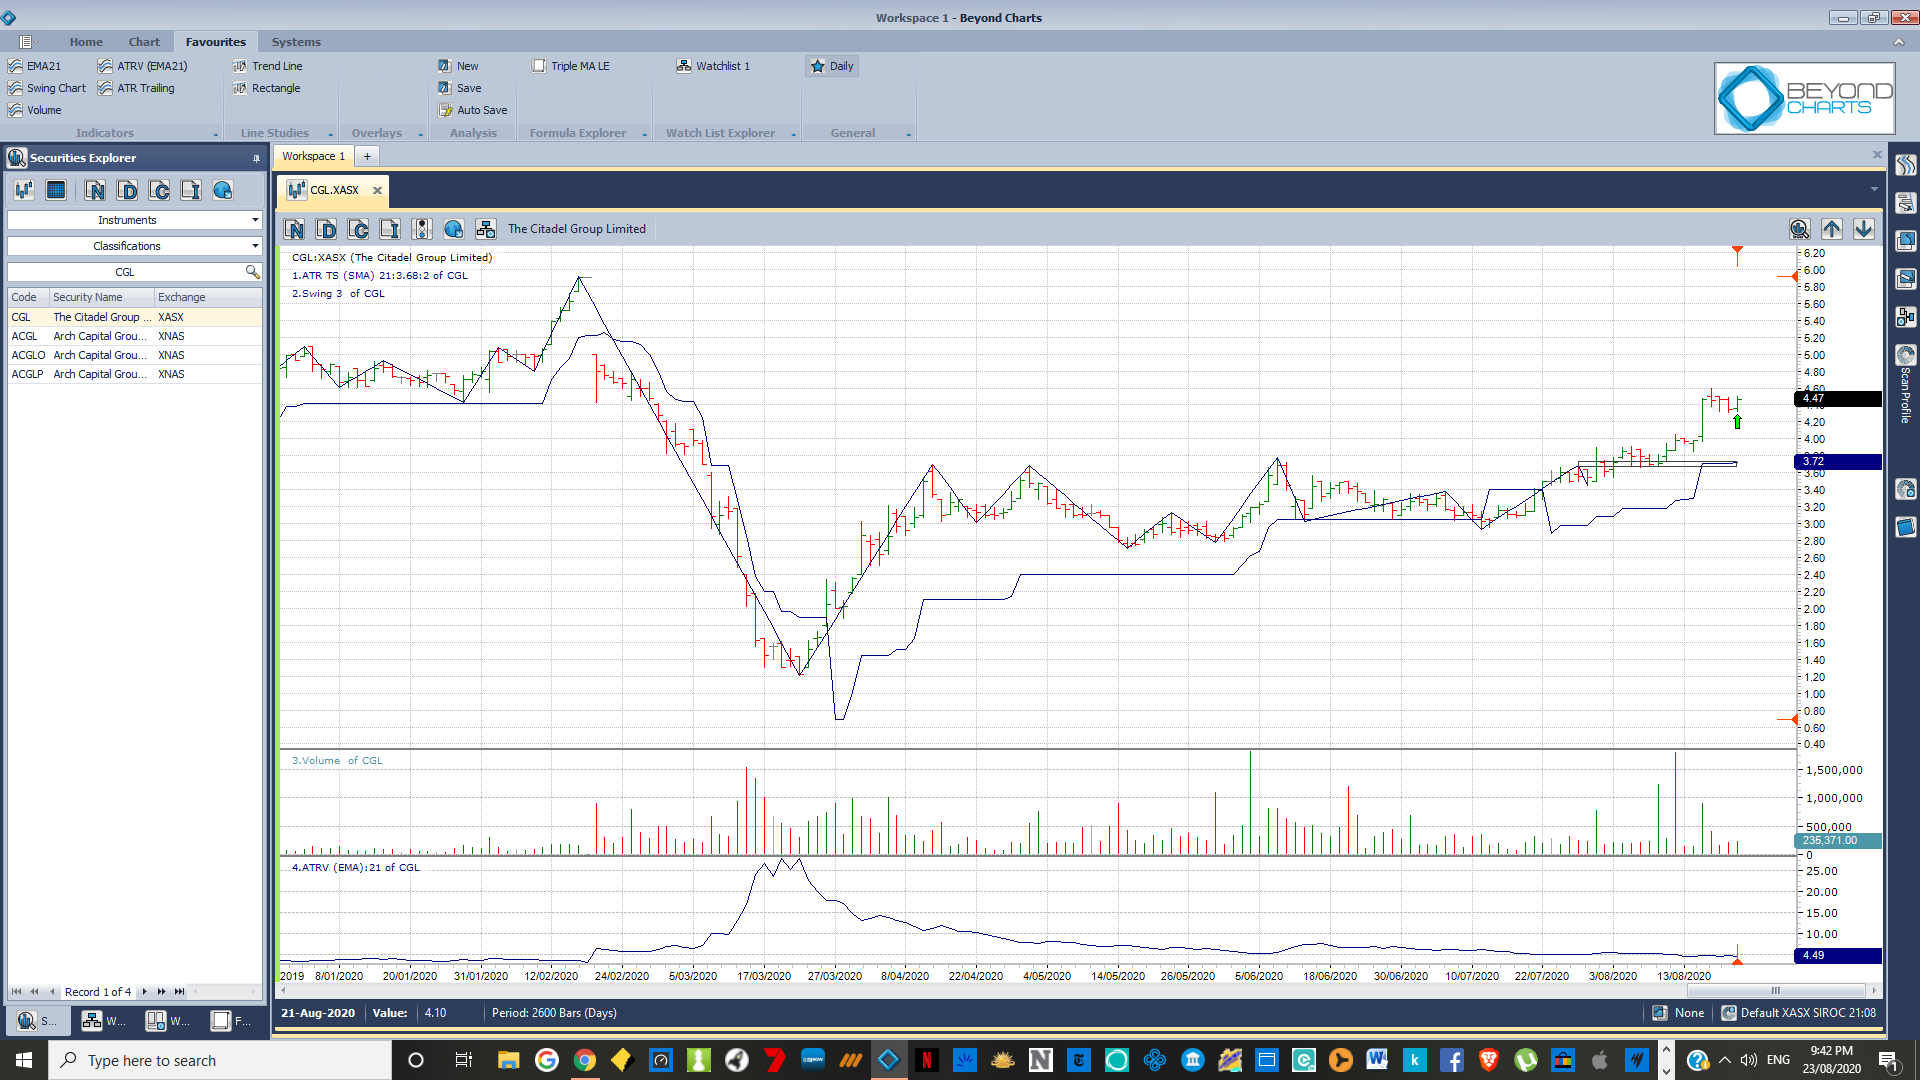
I have run the Gold Rush scan and I have identified CGL as a potential Buy. The buy signal is above the highest of the two previous Swing Charts peaks, above resistance, good liquidity, no volume peaks, above ATR Trailing Stop and low ATRV.
Can someone comment if they agree?
Gary
Looks good to me. I whittled down my Friday scan to 5 or 6 stocks that I’ll be bidding on and this is one of them. Looks like potential resistance at around the $4.80 level and than a big yawning gap around May 2019. This is a tech type stock and a few of these came up in the scan. My question is can the ATR trailing stop as per Gary’s 12/8/20 gold podcast be applied to this type of tech stock or should one stick with the SPA3 trader indicators? I realise there’s no right or wrong answer to this.
Regards Ian
It is not a valid entry for me as the ATRVE is 4.49
According to my rules it must be 5 or more.
Also, my ATR TS is set on ema not sma
Also I use liquidity not volume as an indicator (minimum 10 times position size or more)
Gary, Tech was included in a scan. The ATR TS was specified for the scans in the webinar. SPA3 Trader has its own set of rules. For me, I would not be mixing indicators and rules from different systems.
Phillip et al,
Blockquote
For me, I would not be mixing indicators and rules from different systems.
Blockquote
You are exactly right. If they were both mechanical systems.
To clarify, SPA3 Trader has been designed to to be executed 100% mechanically. Doing so over the last 19.5 years has achieved 13% CAGR in the Risk Profile 1 Public Portfolio.
The process I went through in the C&G Webinar for the IT/Gold Rush is NOT a mechanical system.
If you execute SPA3 Investor and/or SPA3 Trader Satellite portfolios, continue do so 100% mechanically.
Then, as explained in the C&G Webinar, another Satellite should be established for the IT/Gold Rush ‘system’. Complete with a documented Investment/Trading Plan for this IT/Gold Rush ‘system’. It should deploy between 2% and 20% of investible capital, depending on capital size & time availability to execute a discretionary trading process.
The idea I put forward in the C&G is to use the SPA3 Trader Scan as an “opportunity finder” and then use additional TA techniques as guidelines to decide whether to take the trade or not. With a priority on finding more explosive shorter-term trades.
Explosive shorter-term due to the Top-down analysis that’s been done prior - using a Relative Strength Comparison of the GICS Sectors to find the currently performing sectors. At some stage this will rotate to other sectors, at which time the focus can change to that/those sector(s).
The 2 suggested exits, one a SPA3 Trader Profit Stop (mechanical exit based on volatility research) and the other a trend-following ATR trailing Stop, are not exhaustive - you can add others but ensure that they don’t clash and don;t have too many - 3-4 max to cater for different price cycles.
Try and take as many SPA3 Trader Profit Stops as you can - your results will be better.
A 3rd exit should also have been mentioned in the C&G Webinar - a WONS1+DS, which is a SPA3 Trader exit. This exit occurs for trades that are initiated with a WONB4+DB signal and the Weekly SIROC rises above 90, e.g. AGD on the ASX.
A Profit Stop won’t occur on these (SPA3 Trader rule), but the WONS1+DS exit will mostly occur before reaching the ATR TS - thereby locking in more profit and allowing a reset of position size for a new trade. If the trend continues up, a WONB5+DB will occur than can be evaluated alongside other opportunities at the time.
Another discretionary exit can be added for such a process, which is focusing for short sharp moves, a Time Stop. Anything from 5 - 15 trading days, i.e. if the explosive run-up hasn’t started, then cut out of the trade to free up capital for another opportunity.
The clearer your rules are defined on paper, the clearer and more confident you will be in executing your process.
In conclusion, many are wondering why I did such a webinar when I’m such a strong and committed advocate for mechanical investing/trading.
Answer: besides the many that have asked for such a session, I know that many more use their discretion anyway. I’d rather some guidelines be provided in a semblance of a framework, than customers start from scratch or go down paths that have a lower probability of working for them. There are so many more short-term trading ideas that don’t work than do work.
Discretionary shorter-term trading is time-consuming and mentally tough. But much can be learnt from trying it. Especially the huge benefits of just being mechanical.
Please ensure that you limit your risks through money management, that is, start small relative to your investible capital using the Core Satellite framework for strategy allocation.
Regards, Gary
Ian Lee, CGL up 7.38% at close today. Off to a good start on day 1 
Excellent, well done Gary, I’m afraid I had a bit of a “Saturday night” last night and by the time I got my act together this morning it had jumped too far ahead for me. Live to fight another day. On another note, my best performing stock since covid? SSG! Up 100% on my entry! Who’d thought that thousands of hipsters buying a shaver and applying to various parts of their anatomy to relieve the boredom of lockdown would be adding to my wealth!
It’s early days yet with CGL. As Aristotle (or Yoda) said “One swallow does not a summer make”
My best performing stock on the ASX is JB Hi-FI (JBL) up 50% + since April so you have done very well with SSG. There is truth in the trading saying that “prices will move higher or lower than you could ever imagine” Who would have imagined Apple would be up 76% and Amazon up 71% since mid April this year as the Covid Pandemic raced around the world?
My Spa3 Investor portfolio which is 90% invested in the US market with 45% exposure to the “FAANG” group through direct satellite stocks and 2 x core ETFs (QQQ & IVV) since late March and is one of the best investment decisions I have made. The total portfolio is up 28% and is tracking slightly above the benchmark S&P 500 Accumulated Index which I am very happy about. I just need to continue to follow the process which as you will appreciate is a daily battle.
Phillip Feller, the Active Strategy #2 is non mechanical method relying on some basic indicators. I would not pass on a promising stock candidate just because the ATRV is 4.49 instead of my 5 rule. Also there is very little difference between an ATR TS ema & sma. The strategy is subjective & discretionary within reason and a buy signal shouldn’t be ruled out due to an indictor parameter being fractionally off. Just my thoughts.
Fair enough. I was only pointing out what I gleaned from the webinar. The atrv is one where I can cull the less volatile, and try to get the bigger movers. I don’t want too many positions and I was just giving Ian another view.
Phillip, I appreciate your comments mate. There is no right way or wrong way with a discretionary method.
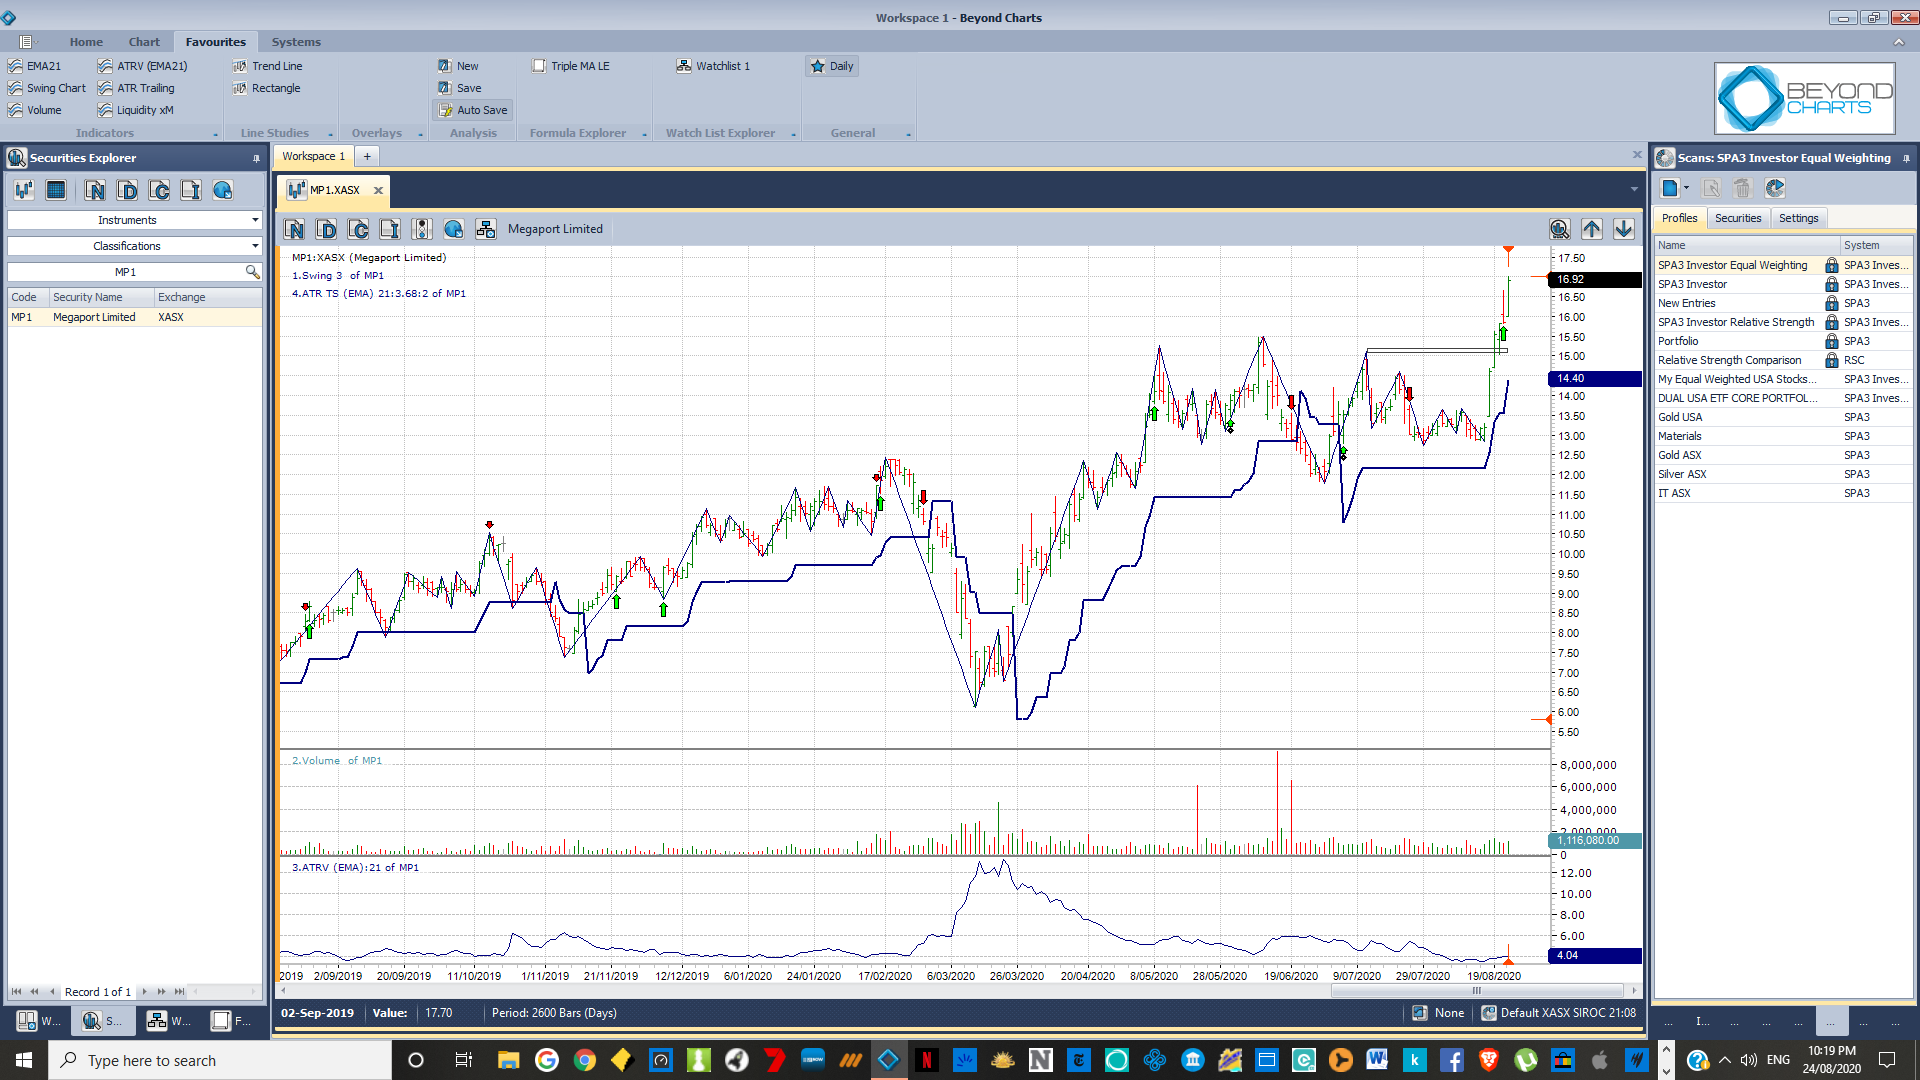
By the way, I am buying MP1 tomorrow and I would be interested in your analysis & comment! The resistance should be down at $13.50 but I decided to set it at two / three previous high resistance levels between $15 and $15.50 so it still looks good as an entry. Screenshot (46)|690x388
Gary, This is not advice for anyone, and I don’t profess to be an expert of any degree. I see ATH, rising macd, steady volume, not too volatile, buying pressure, would consider a buy for me on a dip today despite atrv under 5 (being discretionary).
Phillip, Is that ATH on XNYS or ATH on XASX?
Sorry Gary, I was referring to ‘all time high’ on MP1. I saw only blue sky above. I was replying to your request for analysis and comment.
I have a question regarding the ATR trailing stop that Gary outlined in his 12th August Gold rush webinar. He used a ATR with 3.68 and 2.0. Can someone describe what the 3.68 and the 2.0 numbers actually do? Apologies in advance for such a newby question. Secondly, if I use this as my trailing stop then the stop is a long way from my entry price. For example chart of GNM attached. My entry is 2.7c’s, but my exit will not be triggered until the stock closes below 1.9c’s. If I were to sell at 1.9c’s this would represent a trading loss of 29.63%, which is a hell of a lot higher than I’m comfortable with or used to. Or am I doing something wrong here? Any suggestions greatly appreciated.
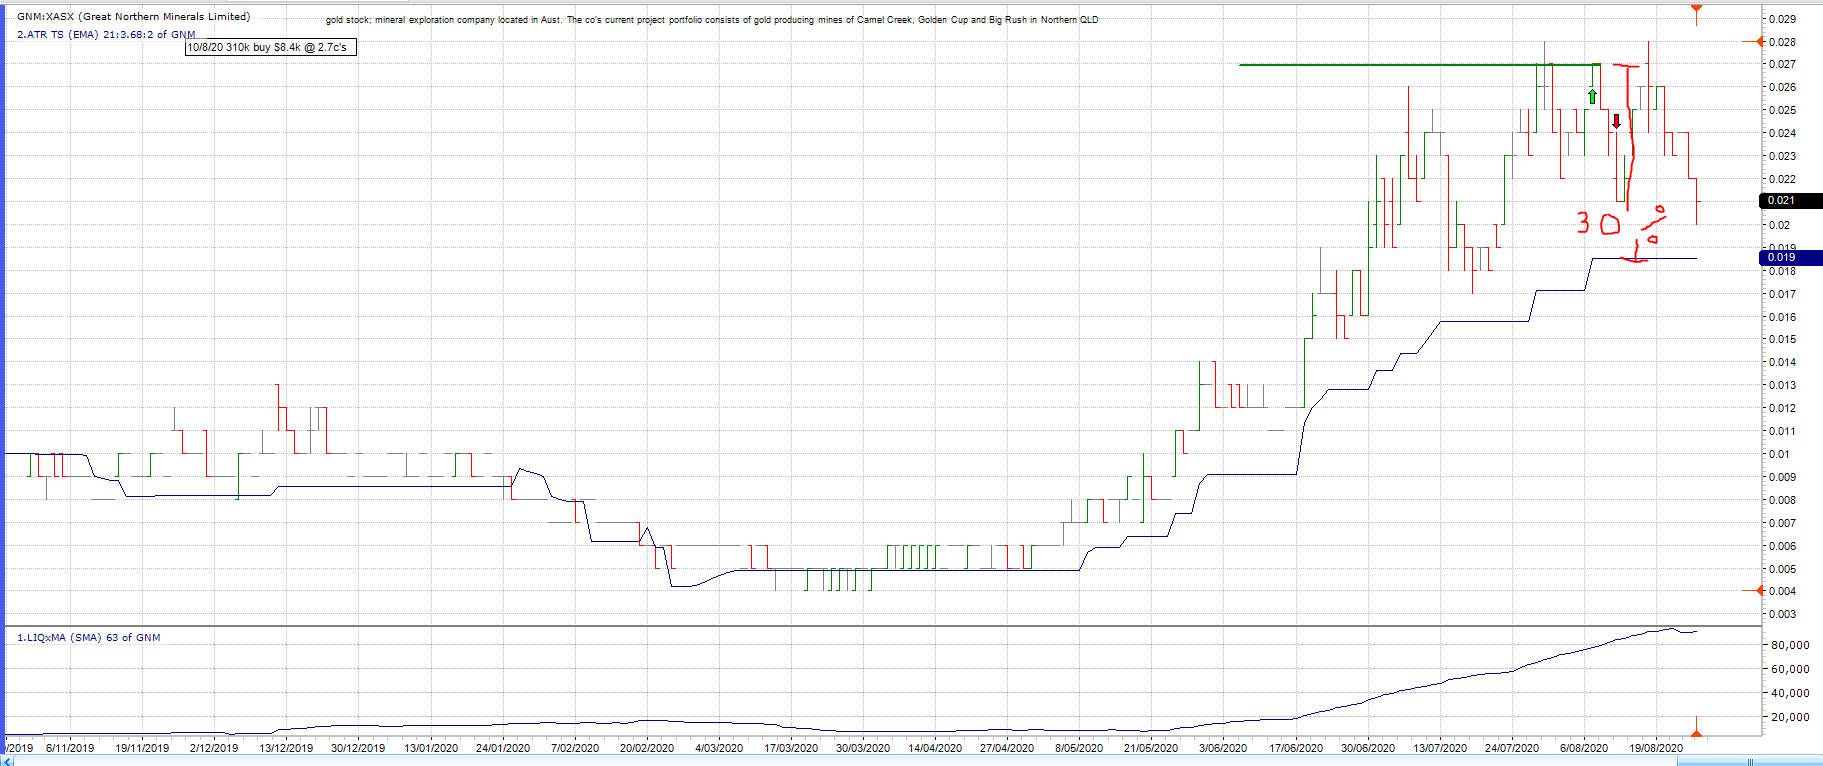
Ian,
Averaging $85K liquidity per day over the lat 3 months. Low, so be careful, small position.
ATRVE 21 is over 9% so pretty volatile. This is why the ATR TS is so far away.
You aren’t doing anything wrong. Just that the risk for GNM is high as will be the potential.
You can manage this risk by reducing your position size based on the volatility. Take smaller position sizes for more volatile (ATRVE 21) stocks.
Regards, Gary
Hi im looking at doing this in the BNPL space. A heap of volatility.
Was wondering where the video was? I cant seem to be able to generate the entry and exit points for my watch list.
thanks